Pencil Cup

I’ve been looking into procedural modeling using Grasshopper. This first model is based on an exercise detailed in the this Primer: http://grasshopperprimer.com/en/index.html?index.html.

Some Winter Drawings

I have been working with OpenCV to detect thresholds, drawing lines along the thresholds and filling them with color. There is no genetic algorithm at play on these yet, still working on the basic approach before adding that dimension.

More Genetic Algorithm Drawings

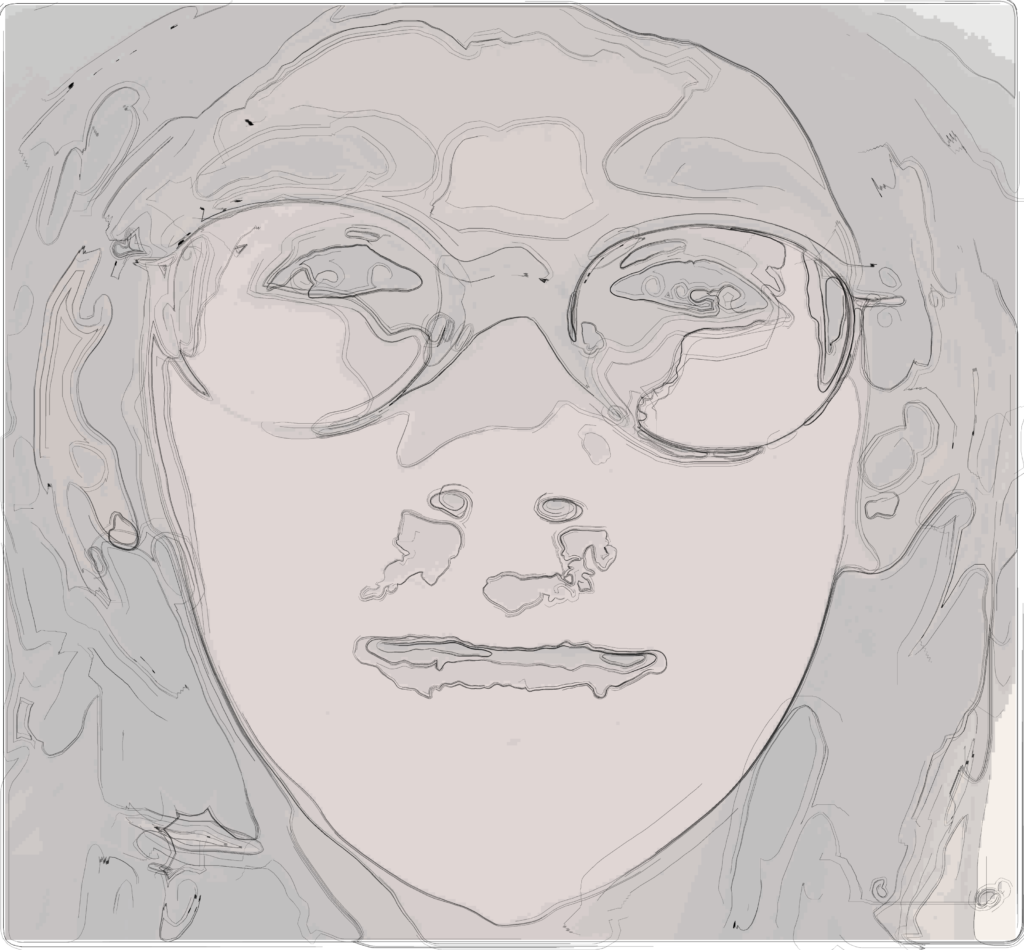
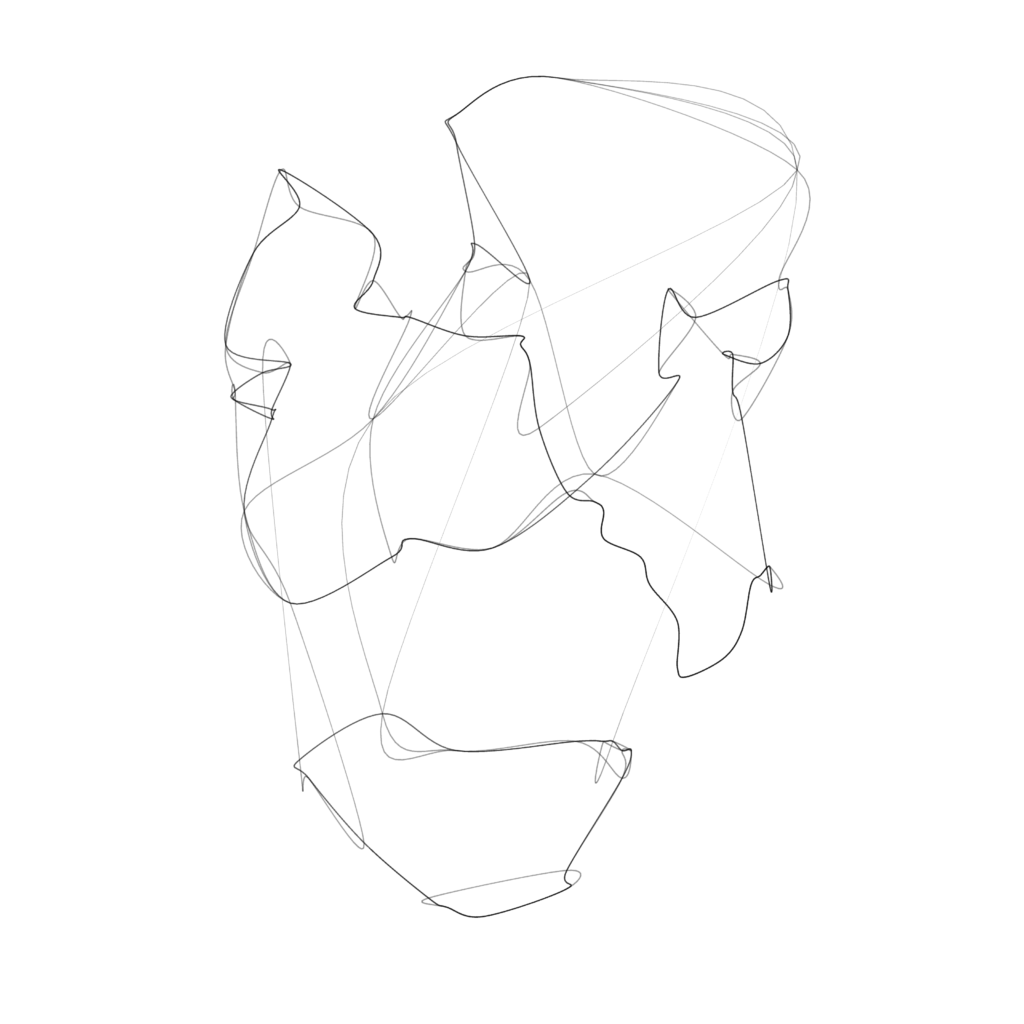
Some more sample results from a drawing app I am working on that uses a genetic algorithm to generate drawing (click for higher resolution):

great-form_individual

Above: face 1, Below: face 2 (same source image as face 1)

great-line_individual

mid_generation

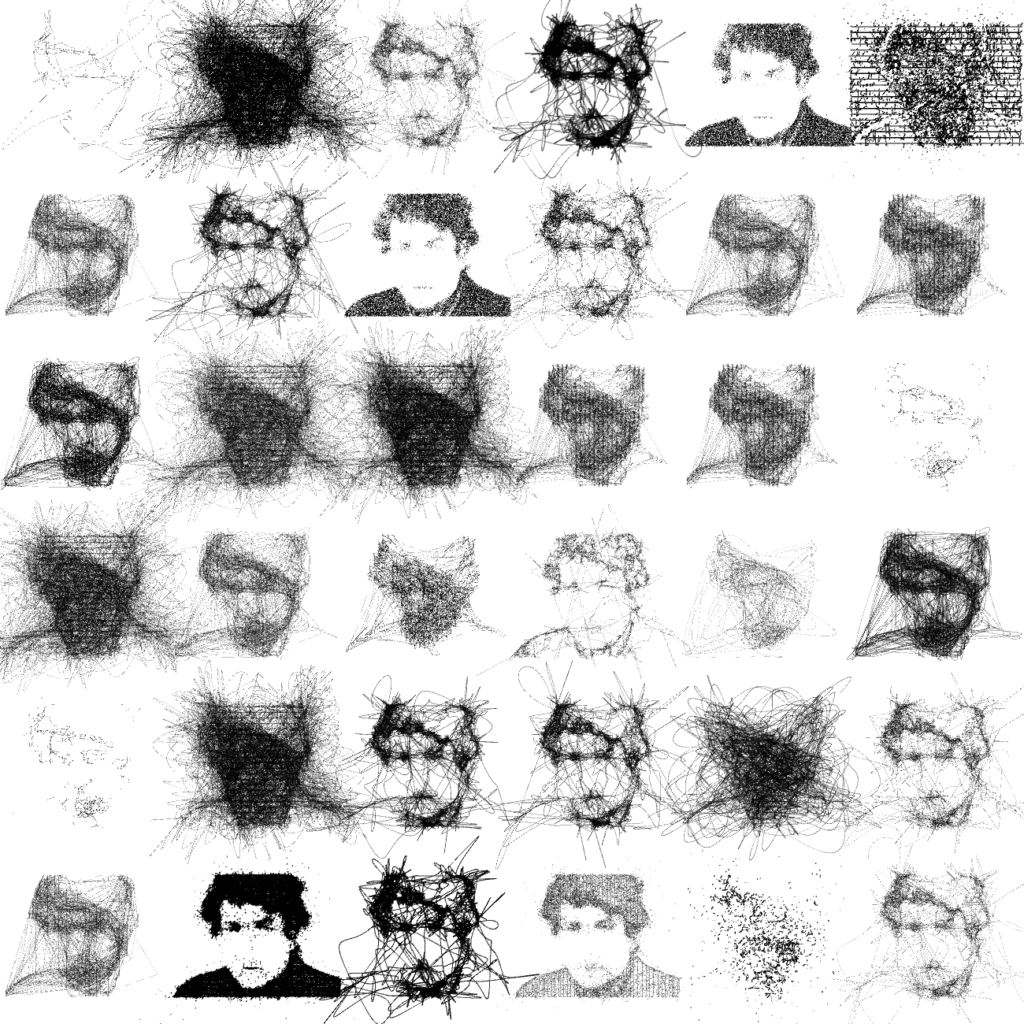
Above: one generation of faces (same source as face 1 and 2)

keeper2

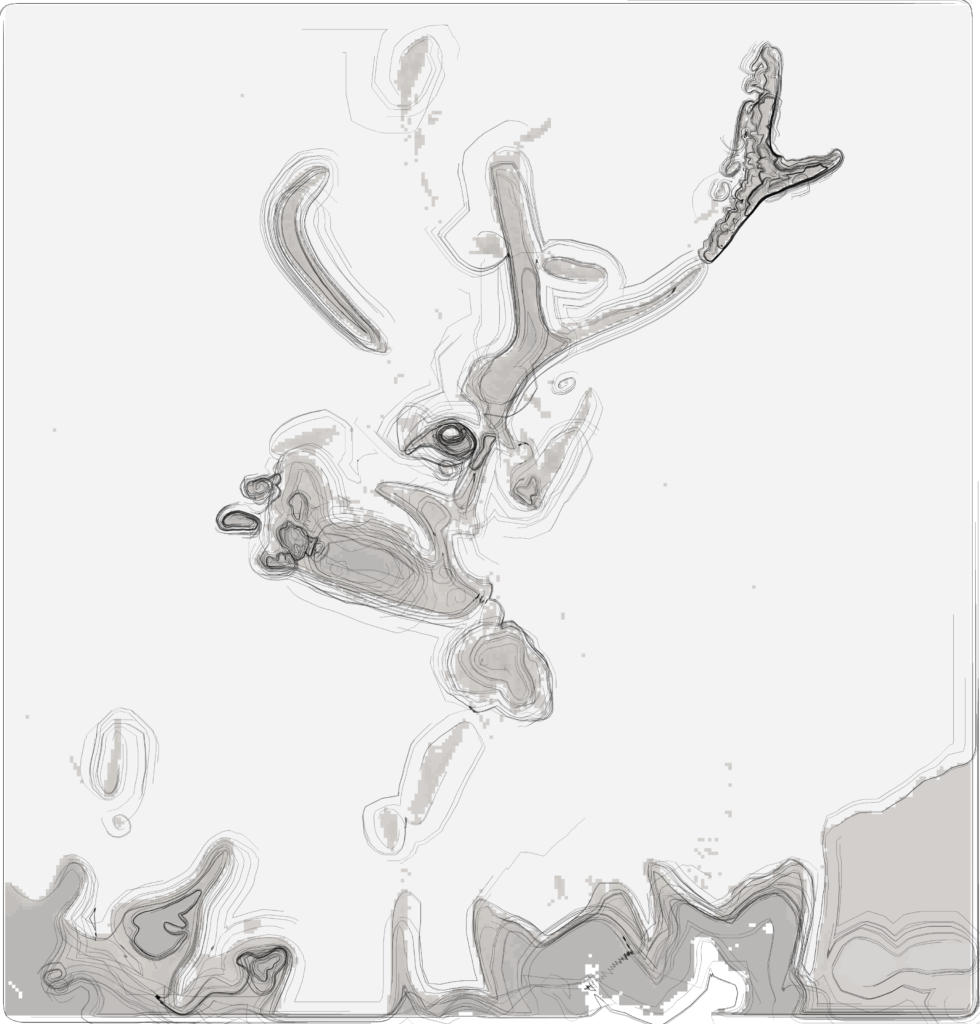
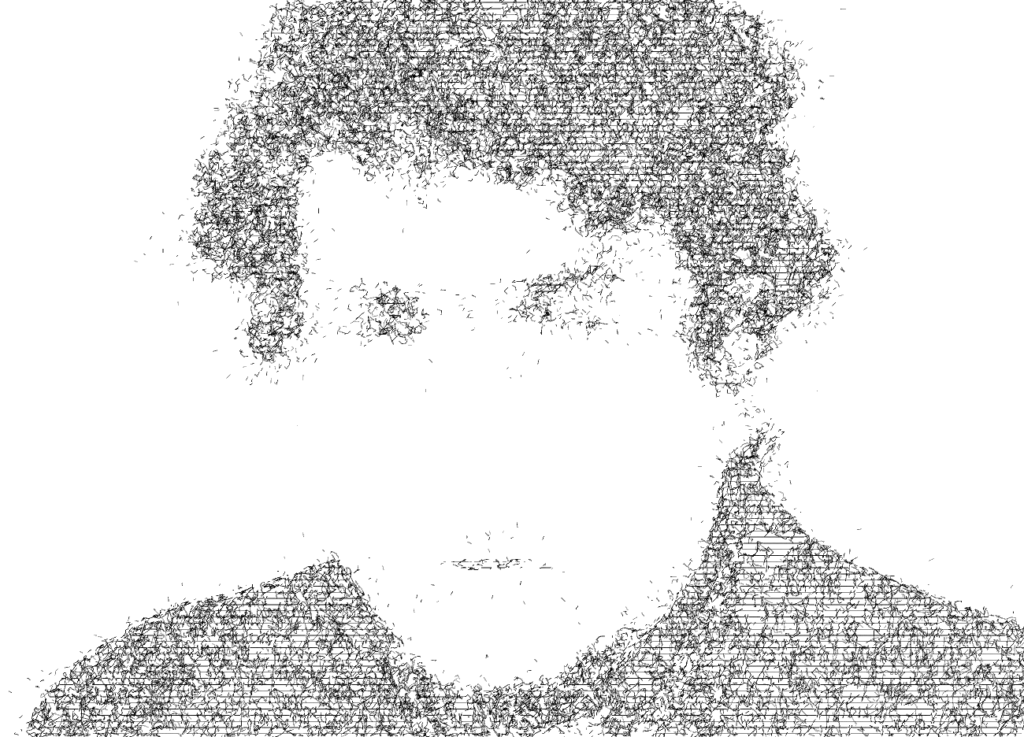
Above: face 3 (different source image), Below: landscape.

keeper

Portrait Drawing with Genetic Algorithm

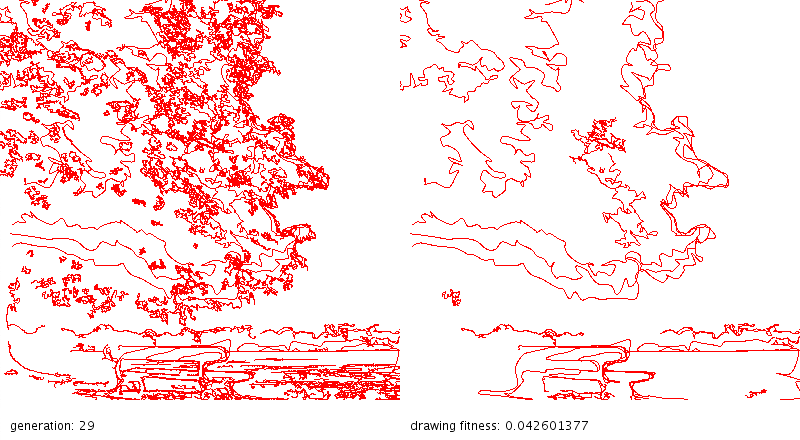
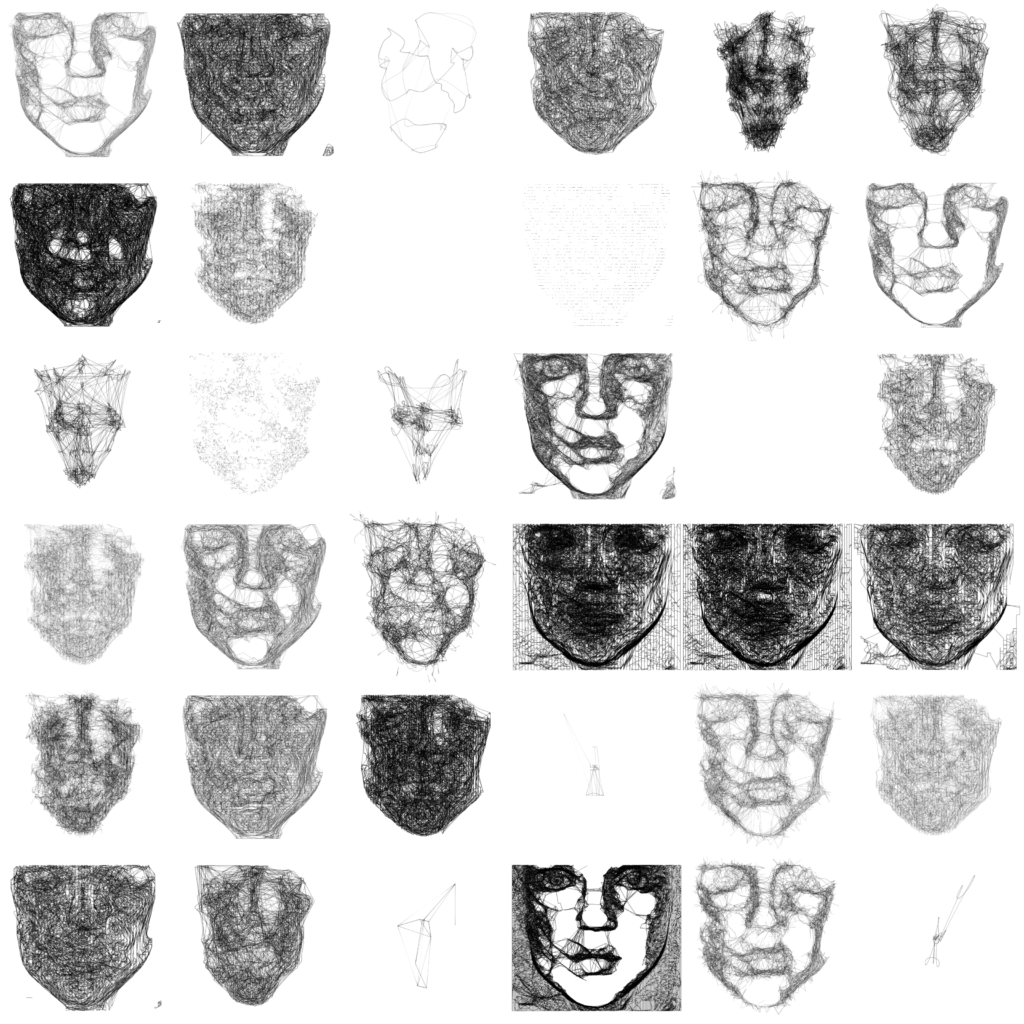
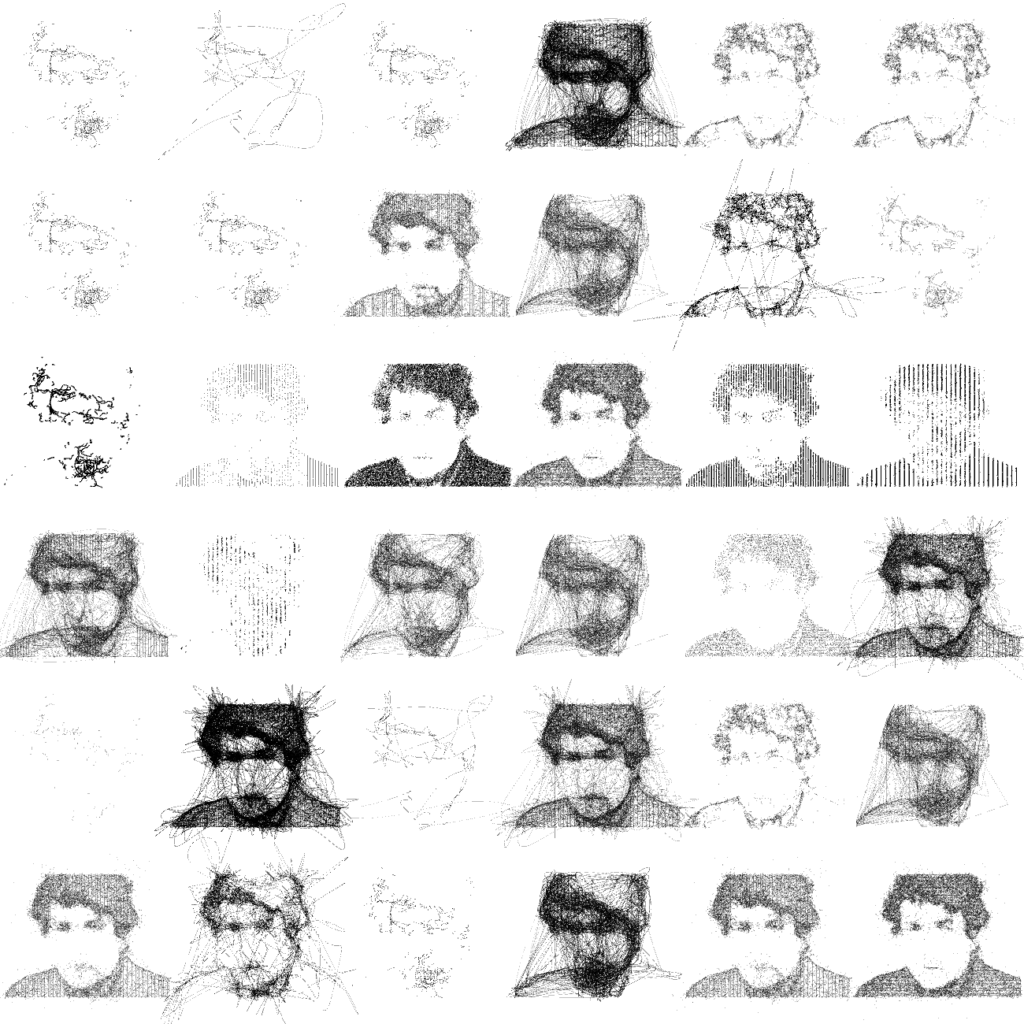
Some results from a drawing program I am working on that uses a genetic algorithm to refine the drawing style. Below is the first generation.

generation-1

First Generation (above) and 4th (below)

generation-4

4th (above) and 7th generation (below)

generation-7 The 7th generation (above) and the 16th image in that generation below. 7-16

Mutants

Screen Shot 2016-08-27 at 1.59.43 PM

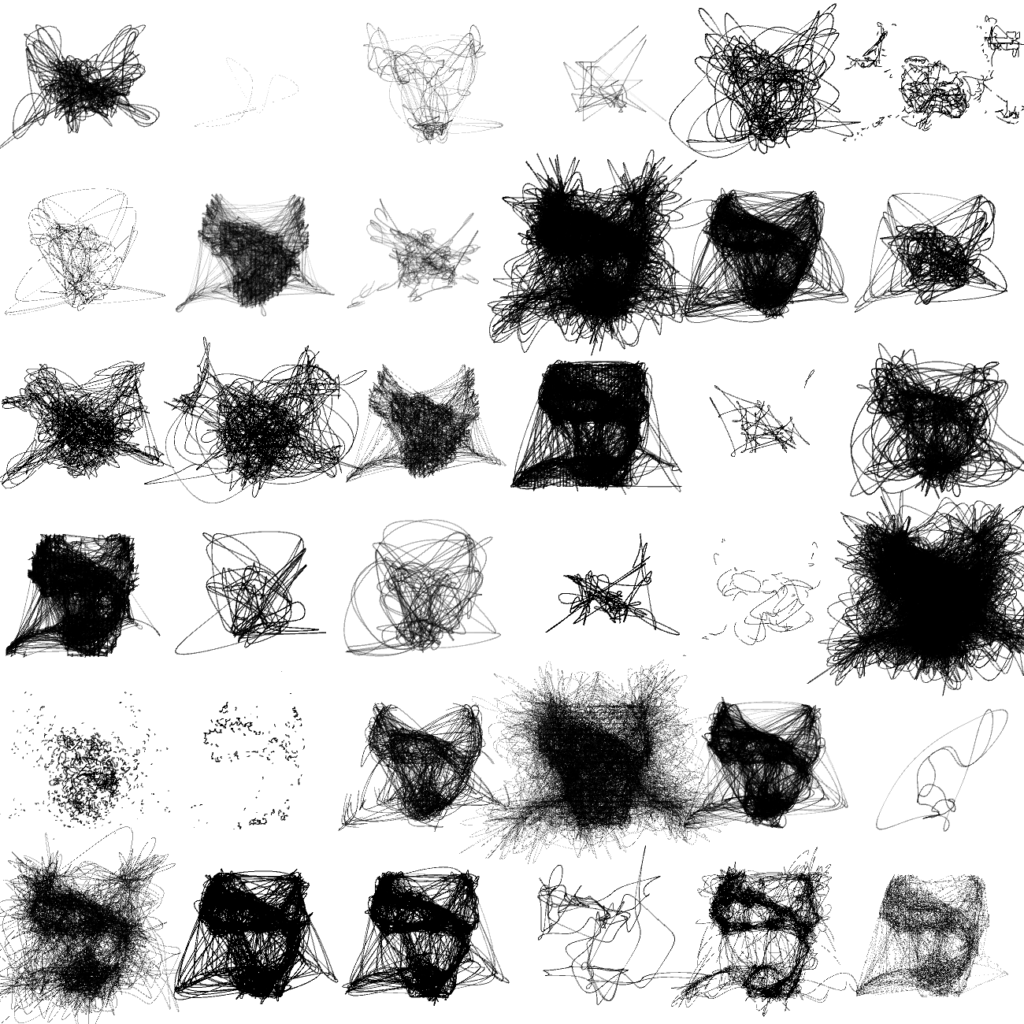
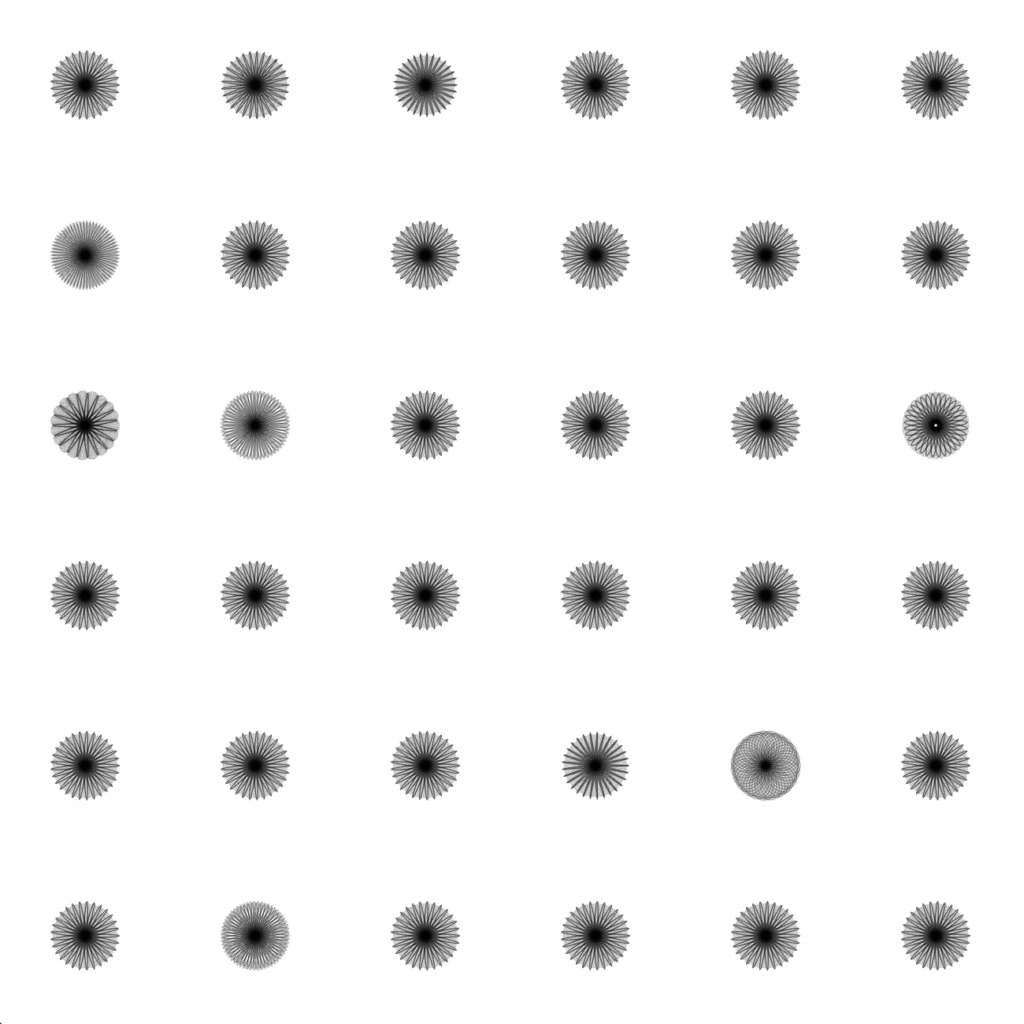
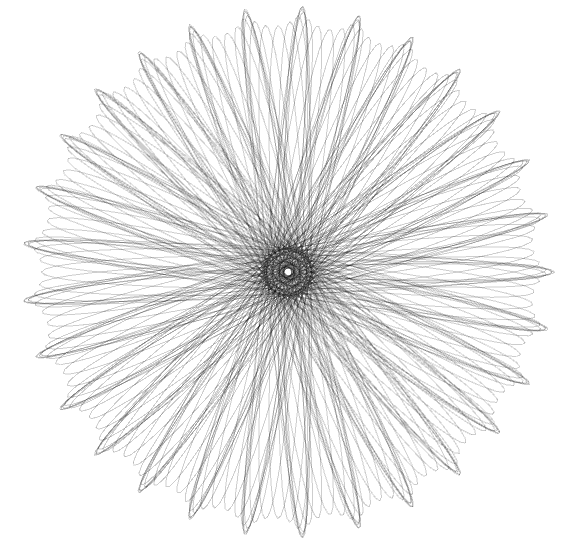
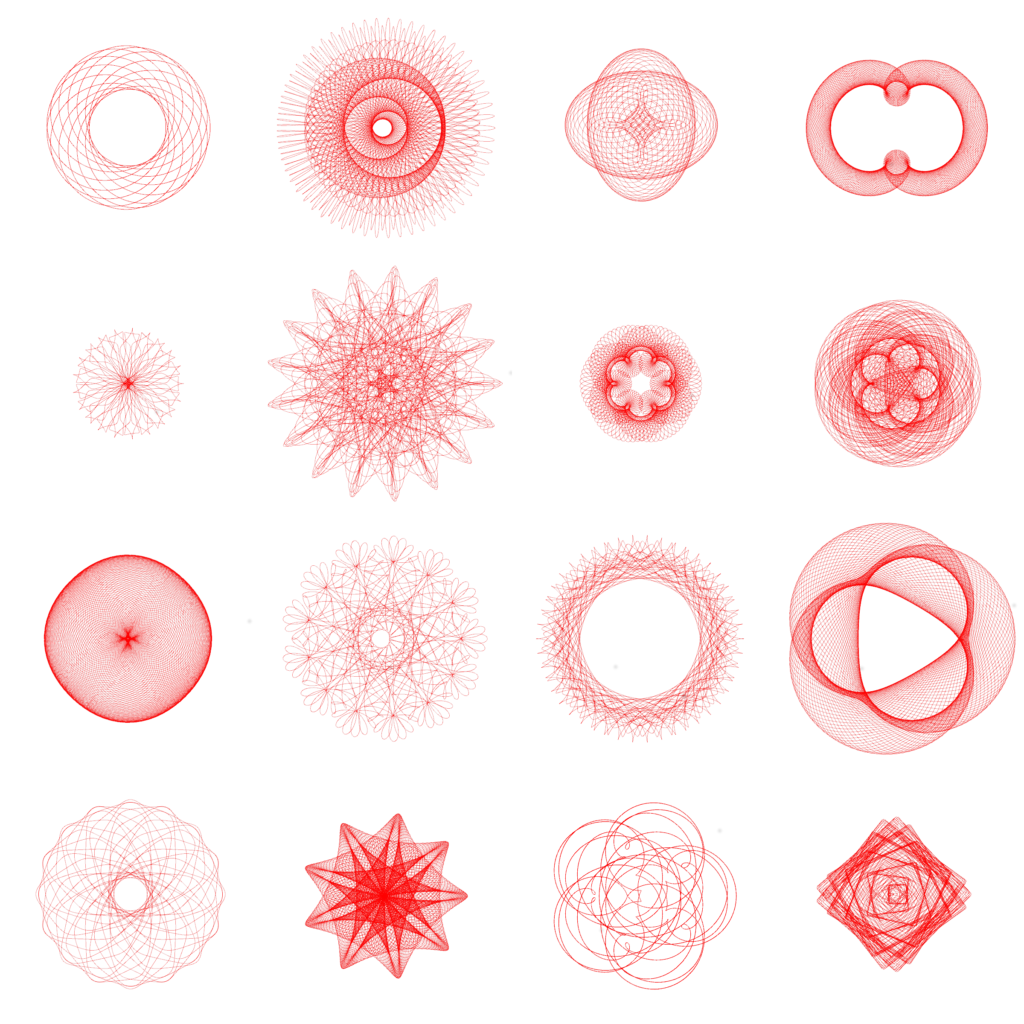
The effects of mutations in one generation of spirographs. Choosing only one graph to survive from the previous generation (not a natural thing to do) results in 36 offspring from the one graph. It is an good way to check the impacts of mutations in the genetic algorithm and has an interesting outcome. The parent graph is below.

Screen Shot 2016-08-27 at 2.05.02 PM


Spirograph

all
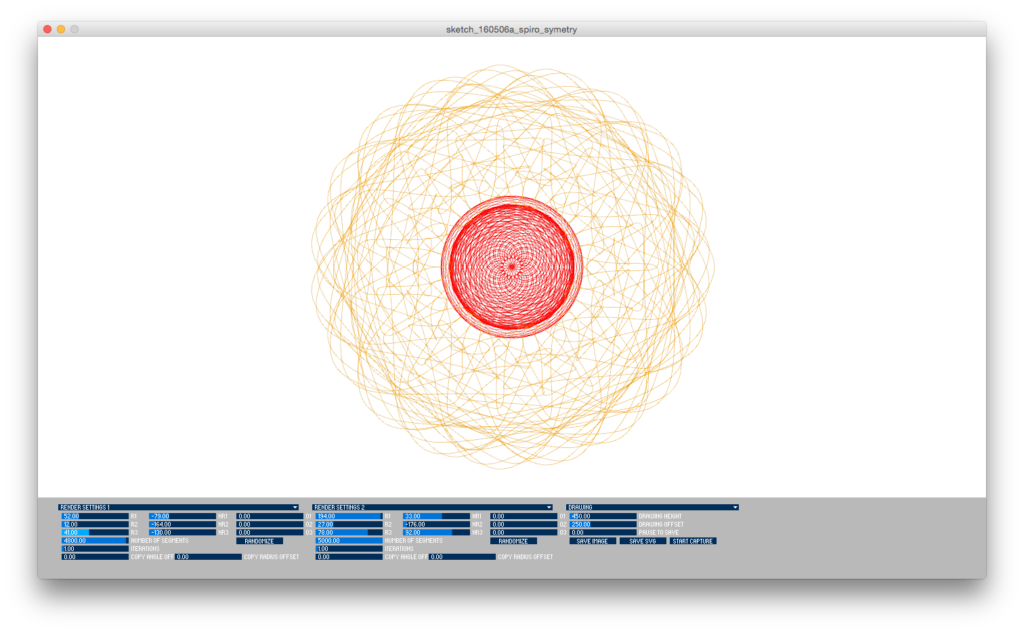
This Spirograph algorithm is not a strict interpretation of the physical Spirograph device but it generates some very similar and interesting results. The basic algorithm is to blend three circular equations together. Specifically, for values of i from 0 to 2 pi, an x and a y value are generated with :

x = r1 * cos(nr1 * i + o1) + r2 * cos(nr2 * i + o2) + r3 * cos(nr3 * i + o3);
y = r1 * sin(nr1 * i + o1) + r2 * sin(nr2 * i + o2) + r3 * sin(nr3 * i + o3);

In many ways, this is like having three lines of length (set as r1, r2, and r3) being placed end to end with each one rotated a given number of times (set as nr1, nr2, and nr3). Each of the rotations also can be offset (set by o1, o2, o3).

Two different graphs can be drawn in this way and each of those graphs can be duplicated by changing the number of iterations (o iterations would hide graph). Each iteration can be offset by an angle or have its radius scaled.

top

Screen Shot 2016-08-16 at 1.36.40 PM

Animated Waves

Building on the previous waves study, this sketch creates it’s own image from three dimensional Perlin noise. For each frame, an image is generated and variations in the brightness are used to vertically offset the horizontal lines, forming waves.

The running sketch (below) shows a frame of the noise and the waves below.

Screen Shot 2016-08-16 at 9.33.22 AM

Waves

Screen Shot 2016-08-16 at 9.23.53 AM

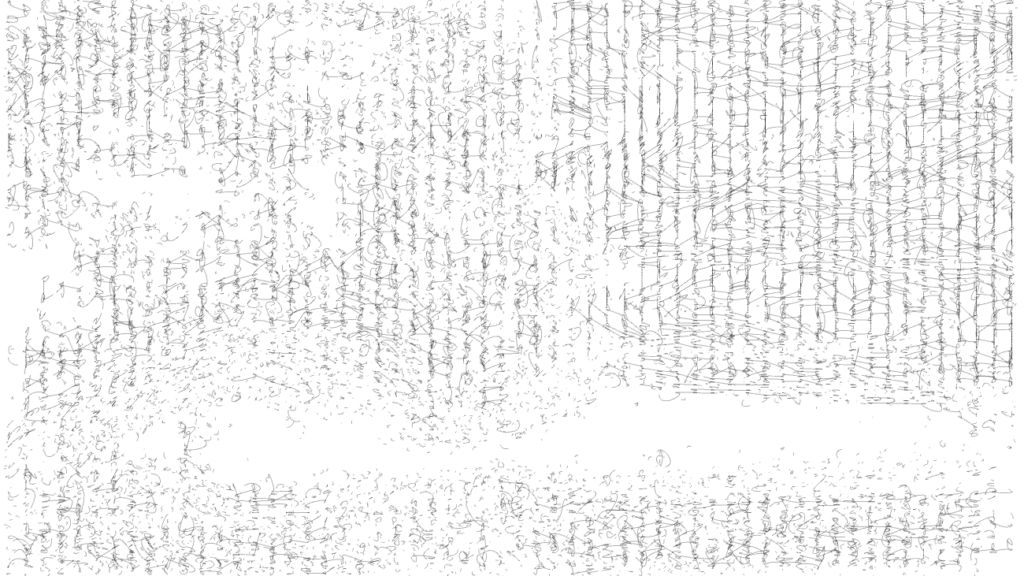
This study focuses on the wave algorithms used in this years eggbot drawings. The sketch supports importing an image, scans the brightness value and draws horizontal lines with vertical offsets based on variations in brightness. around any given sample point along the horizontal line.
settings1