
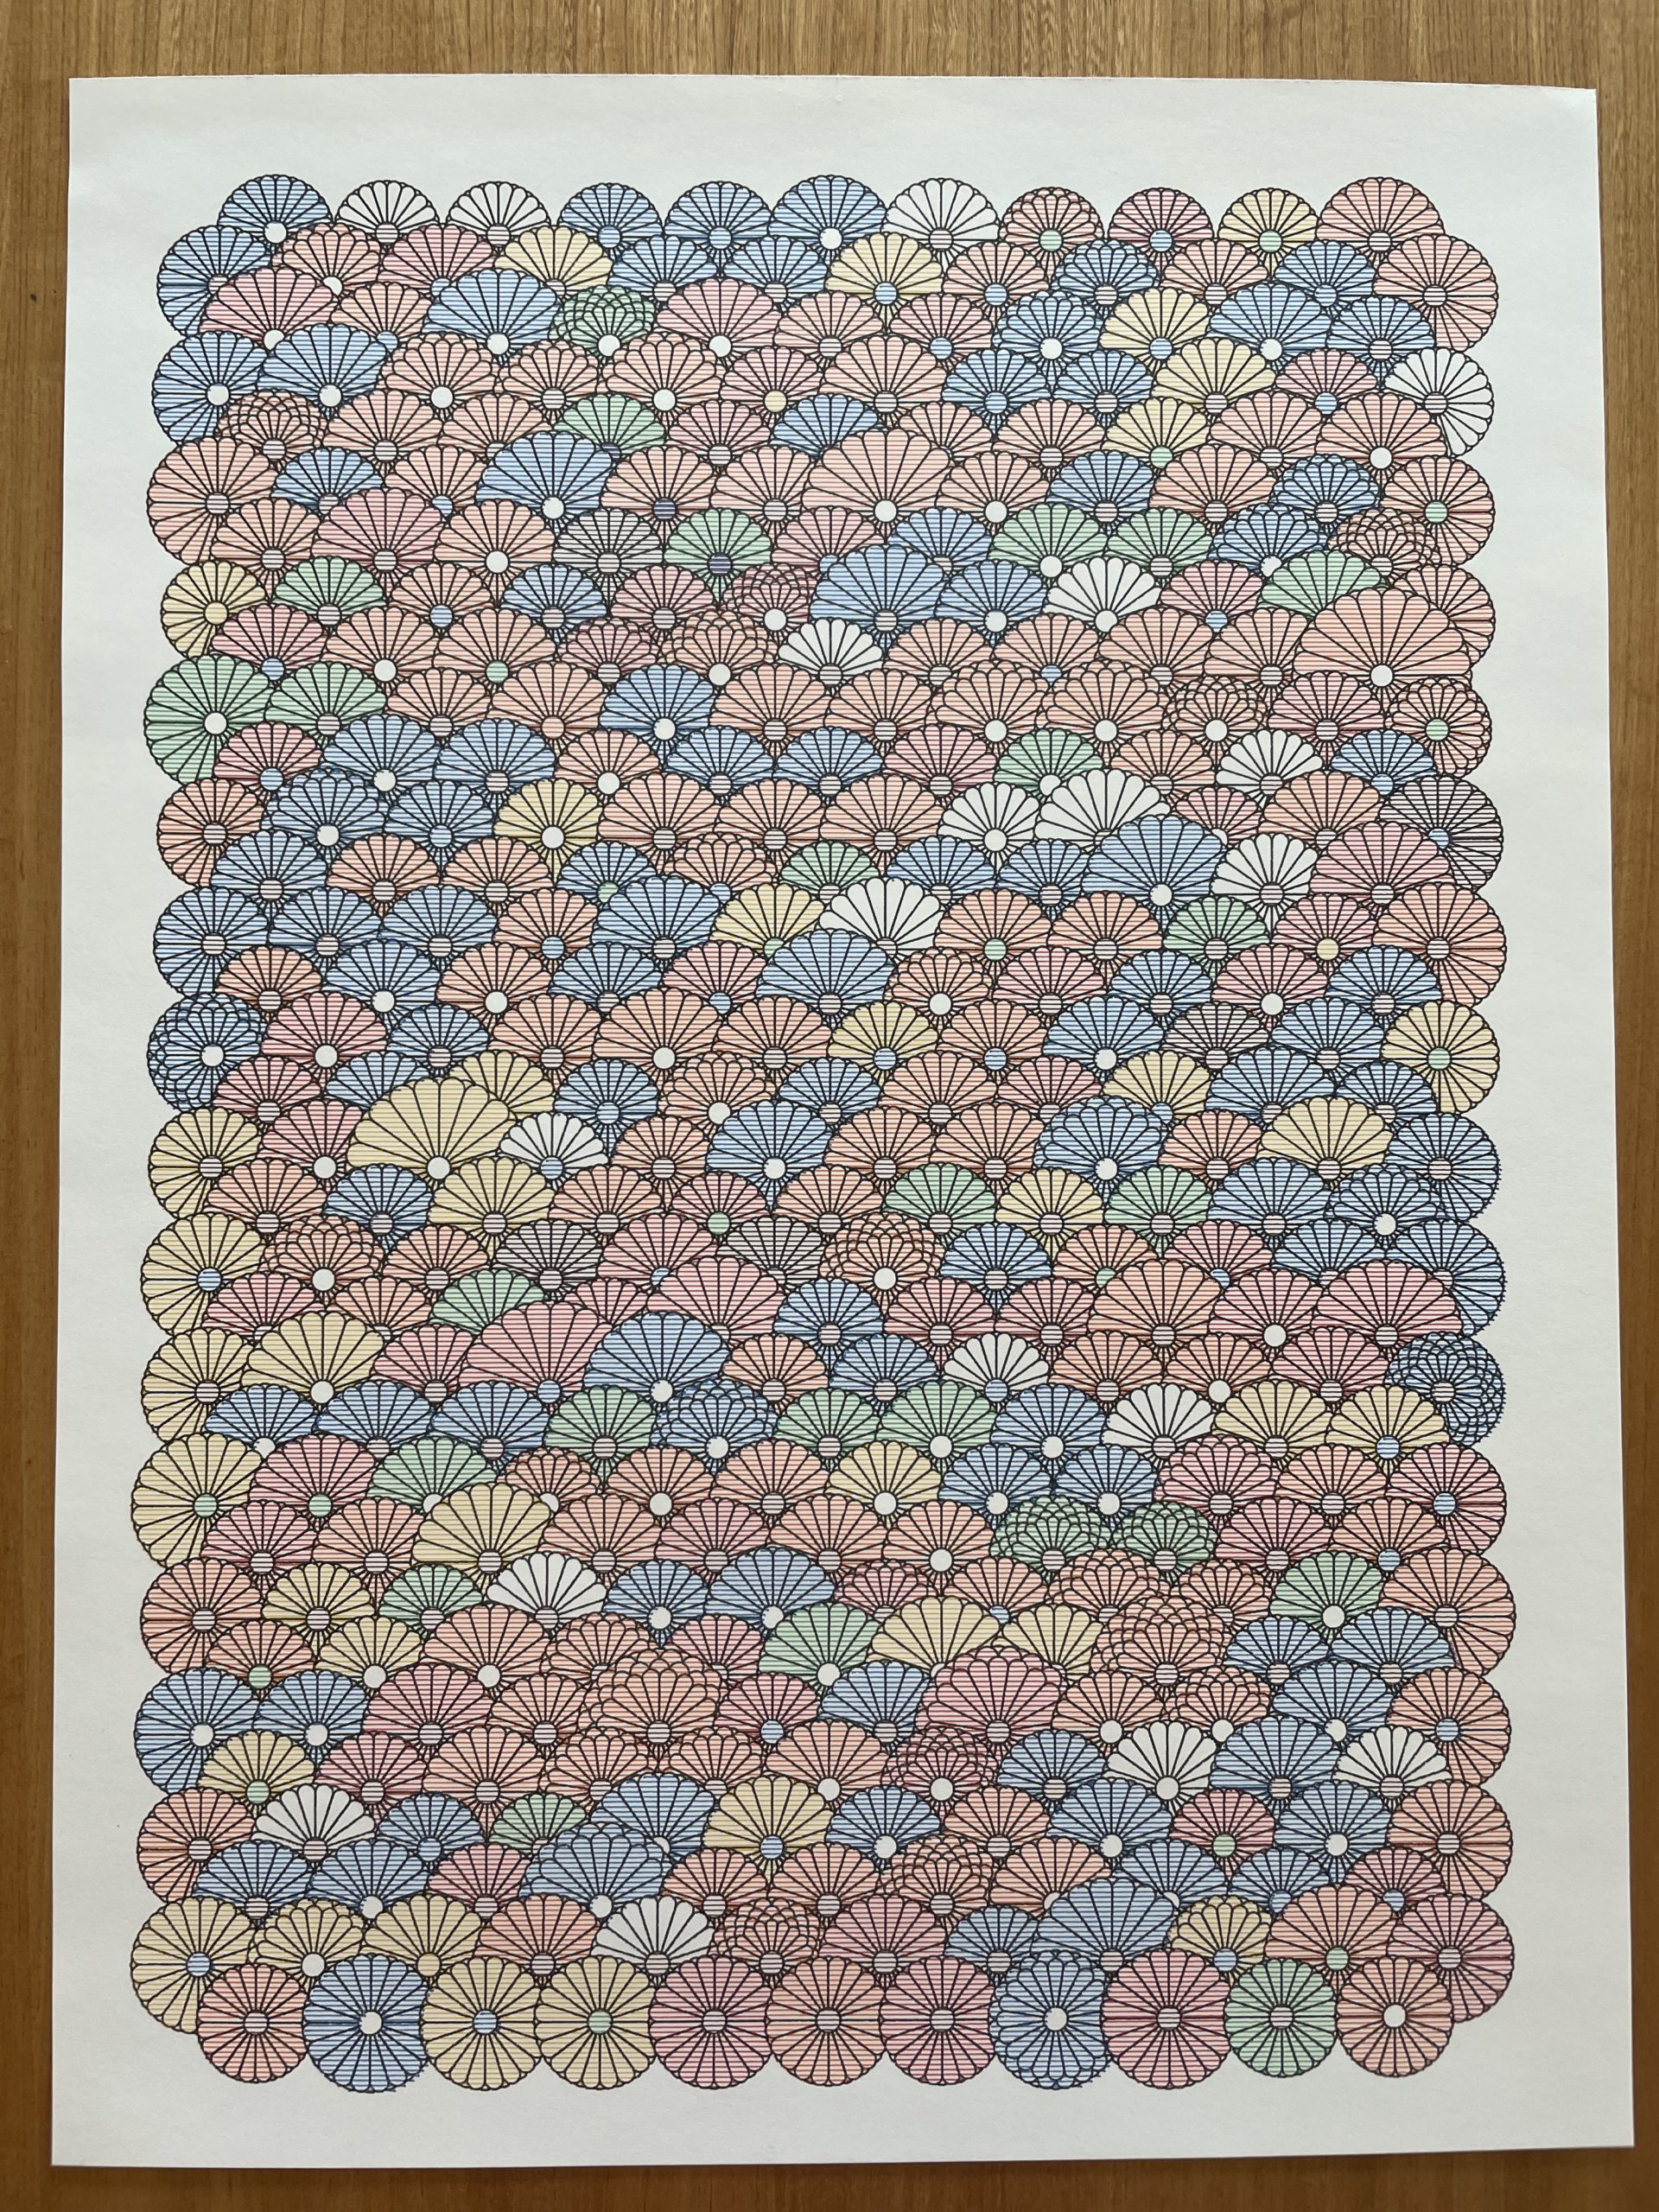
Gradient


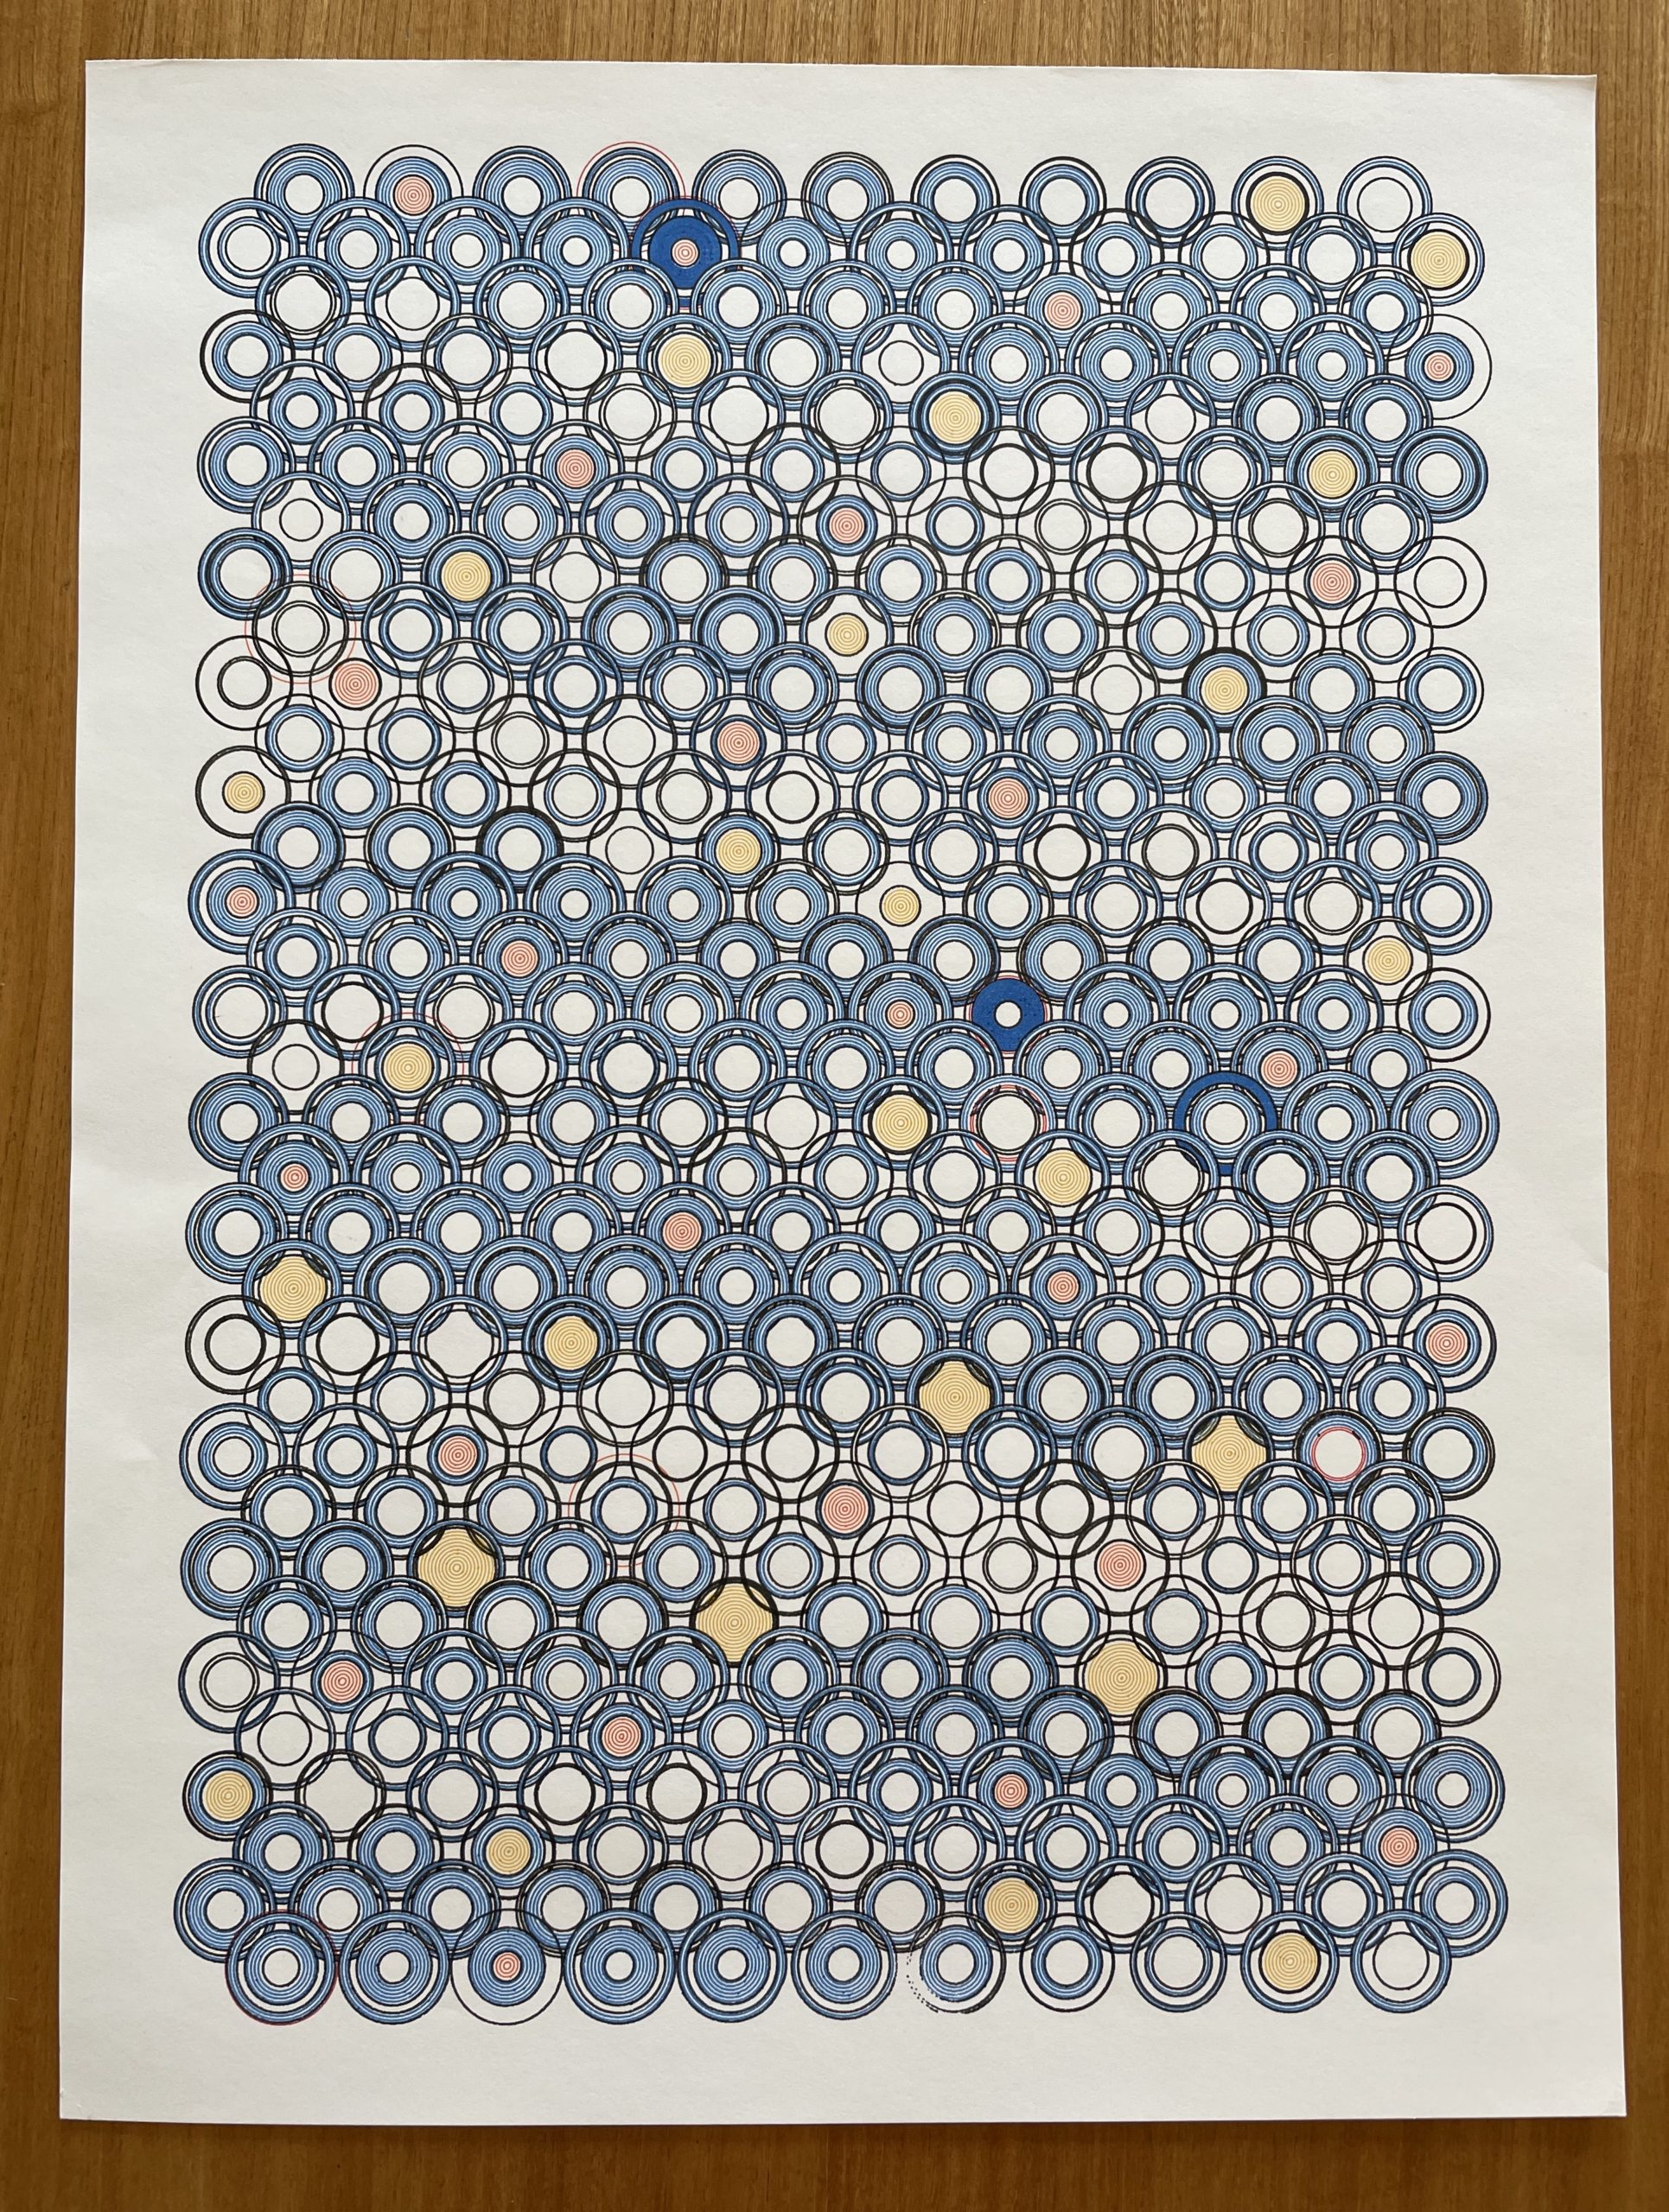
Drawing derived from forecast tides for 379 days. High and low tides are utilized as well as phases of the moon, equinoxes, and solstices.

This drawing is made using data from the largest earthquake every day for 379 days. The magnitude, depth, and continent that it occurred on are utilized. The intent is not to visualize the data for evaluation, but use it as a composition element.
The flowers are inspired by a traditional Japanese textile pattern.

Surface currents from nine SF Bay Area HR Radar stations.
Face illustrations generated using a simple substitution grammar and then plotted to paper.


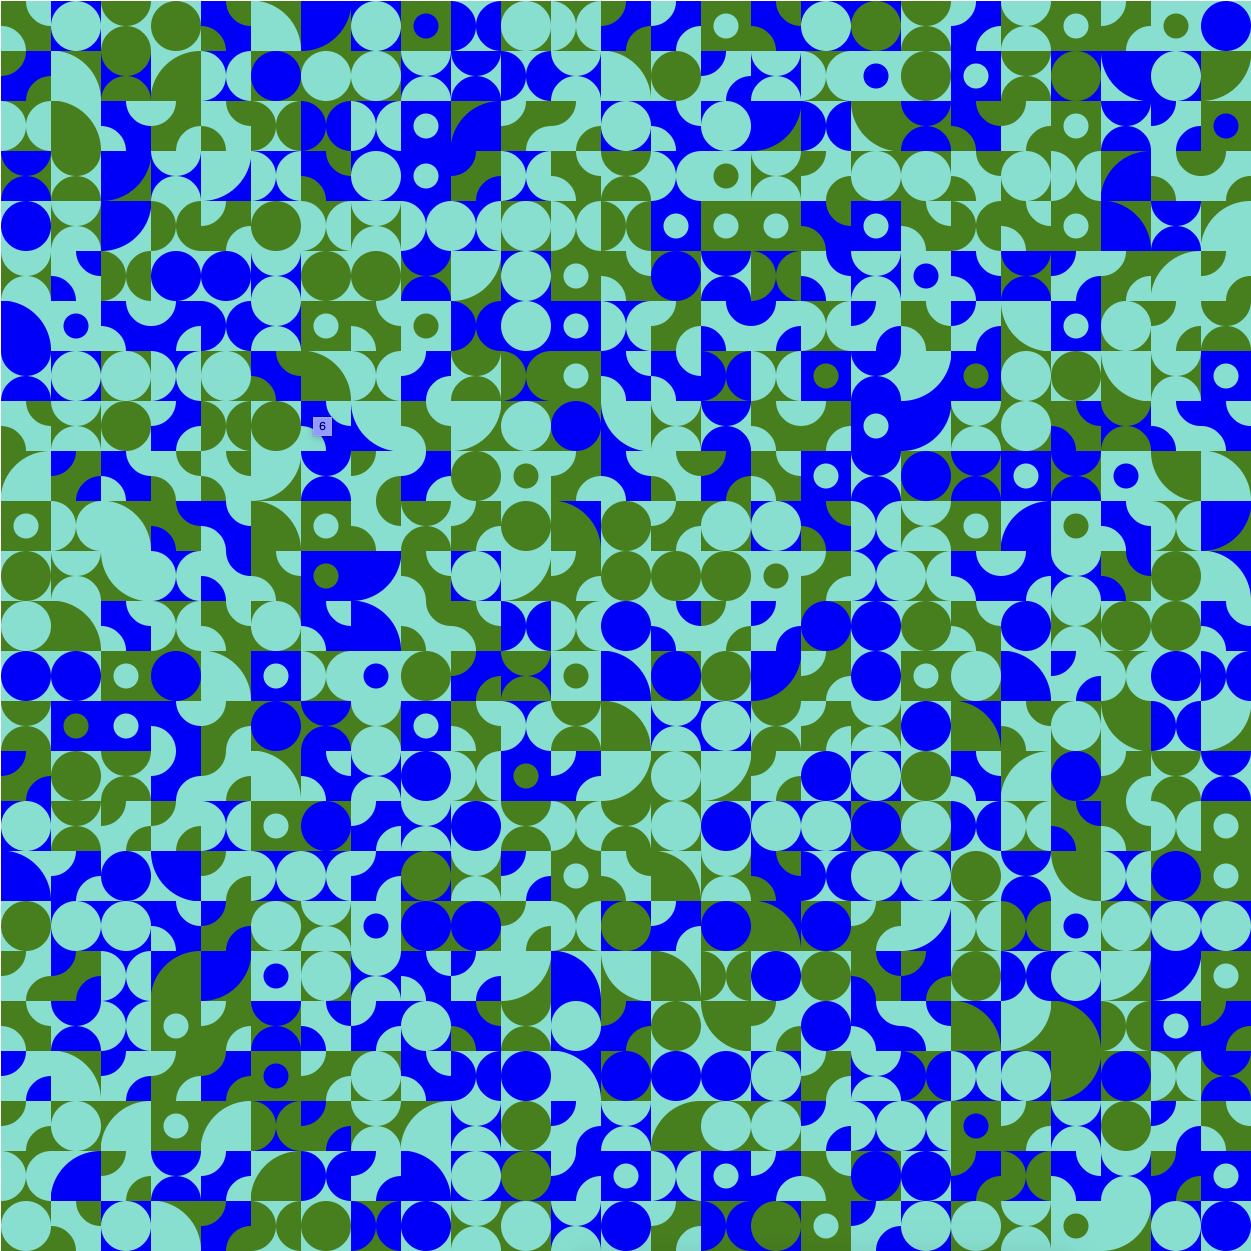
Detail:
