
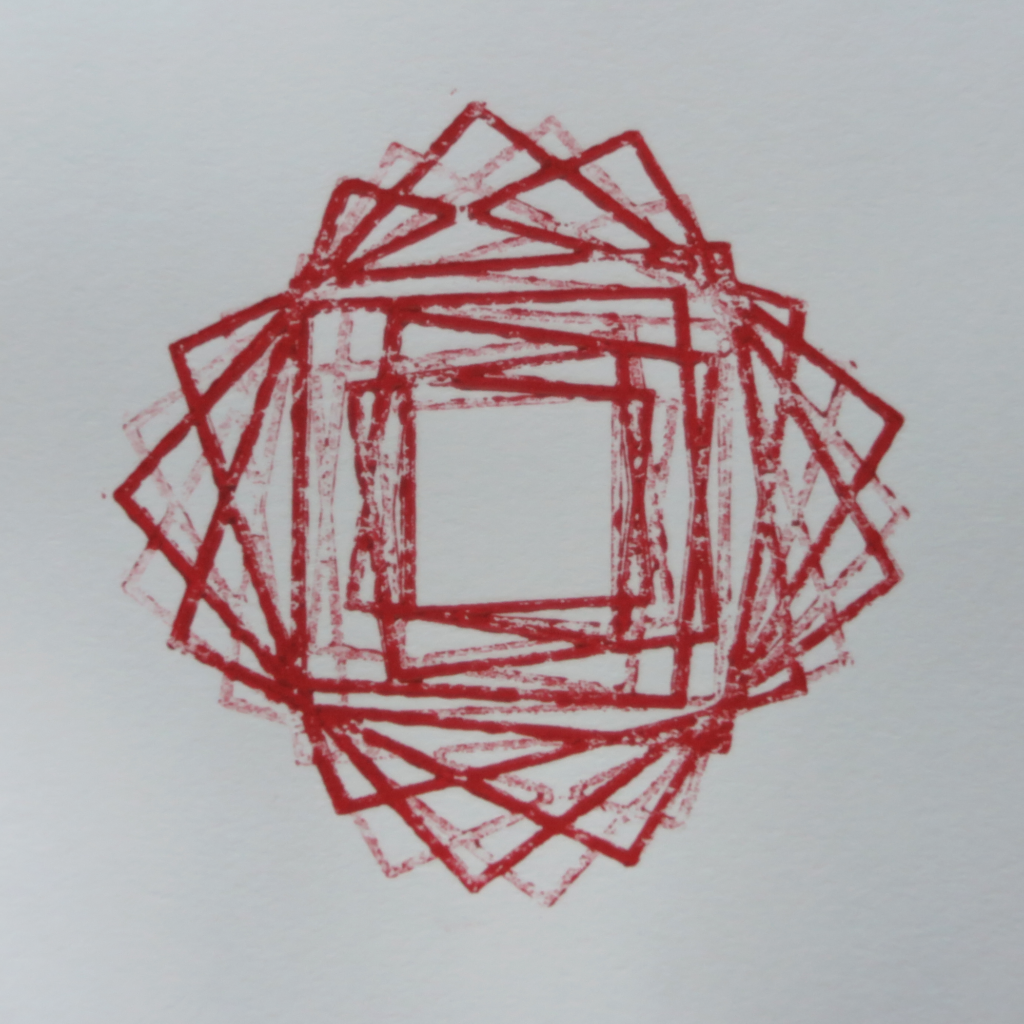
Drawing derived from forecast tides for 379 days. High and low tides are utilized as well as phases of the moon, equinoxes, and solstices.
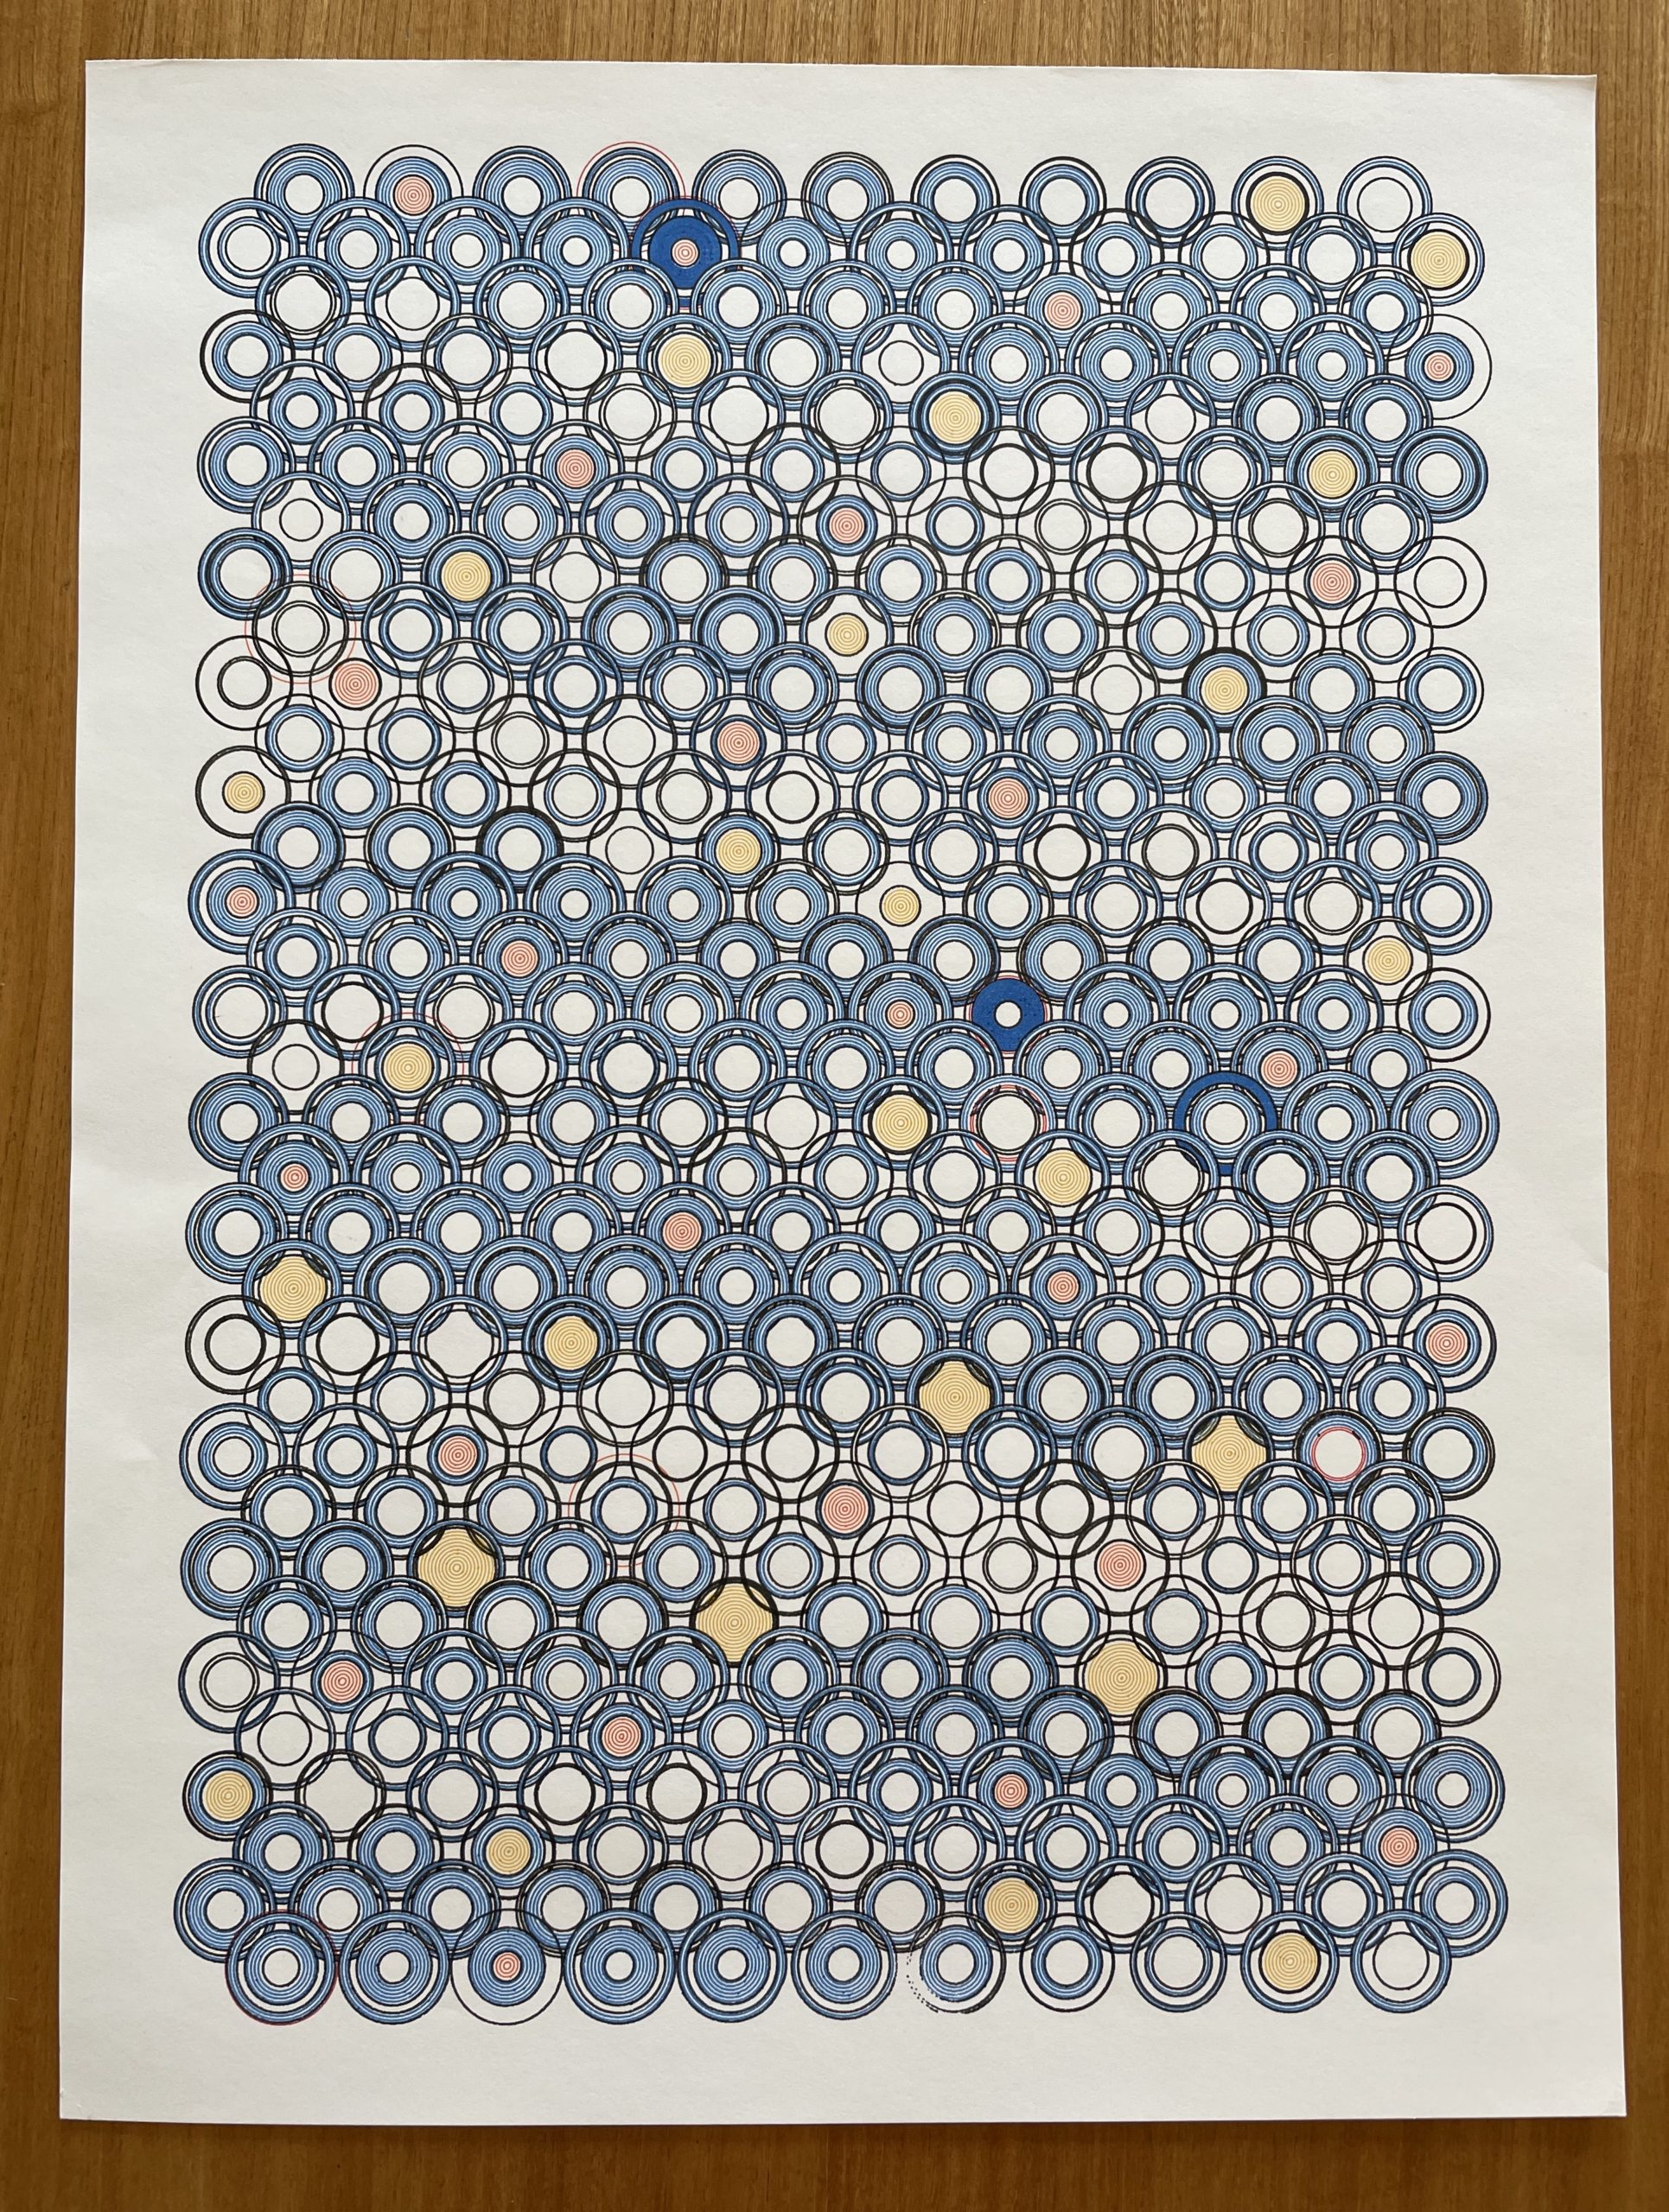
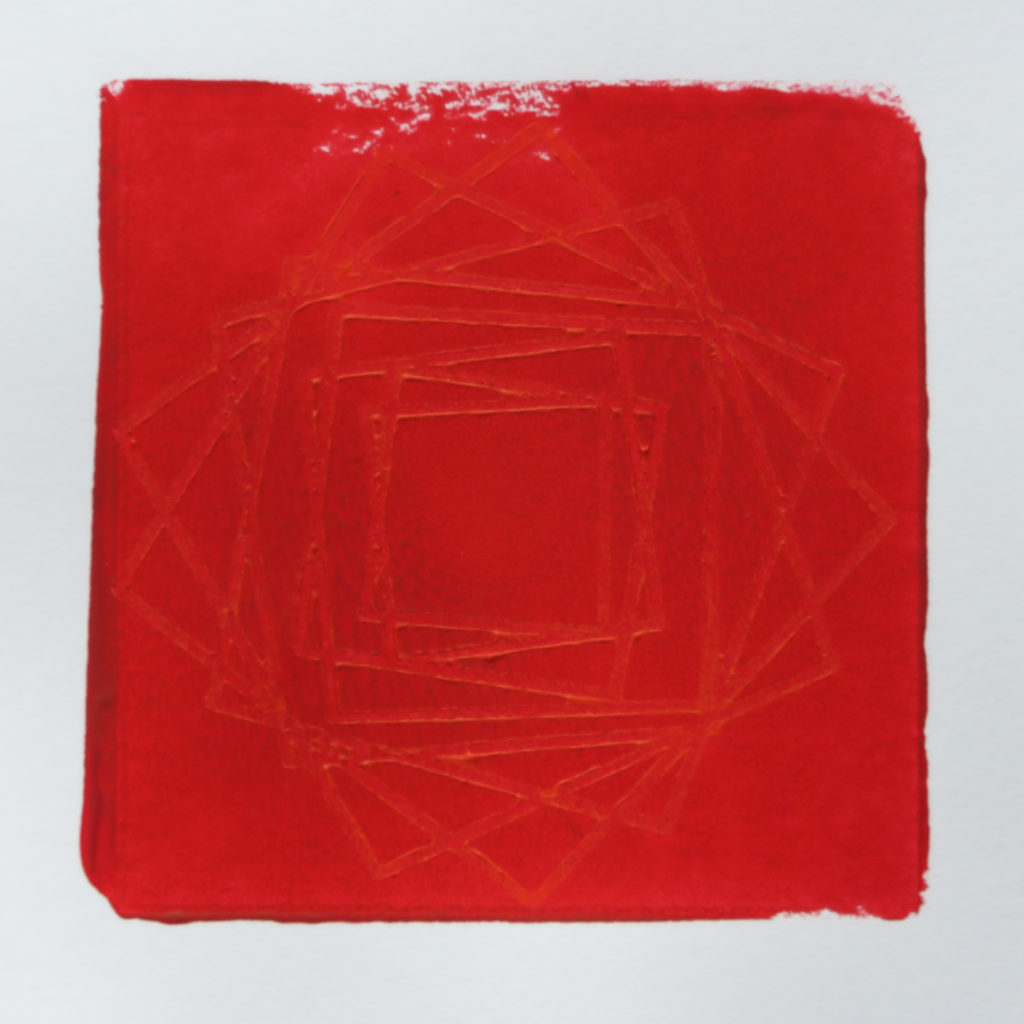
Drawing derived from forecast tides for 379 days. High and low tides are utilized as well as phases of the moon, equinoxes, and solstices.

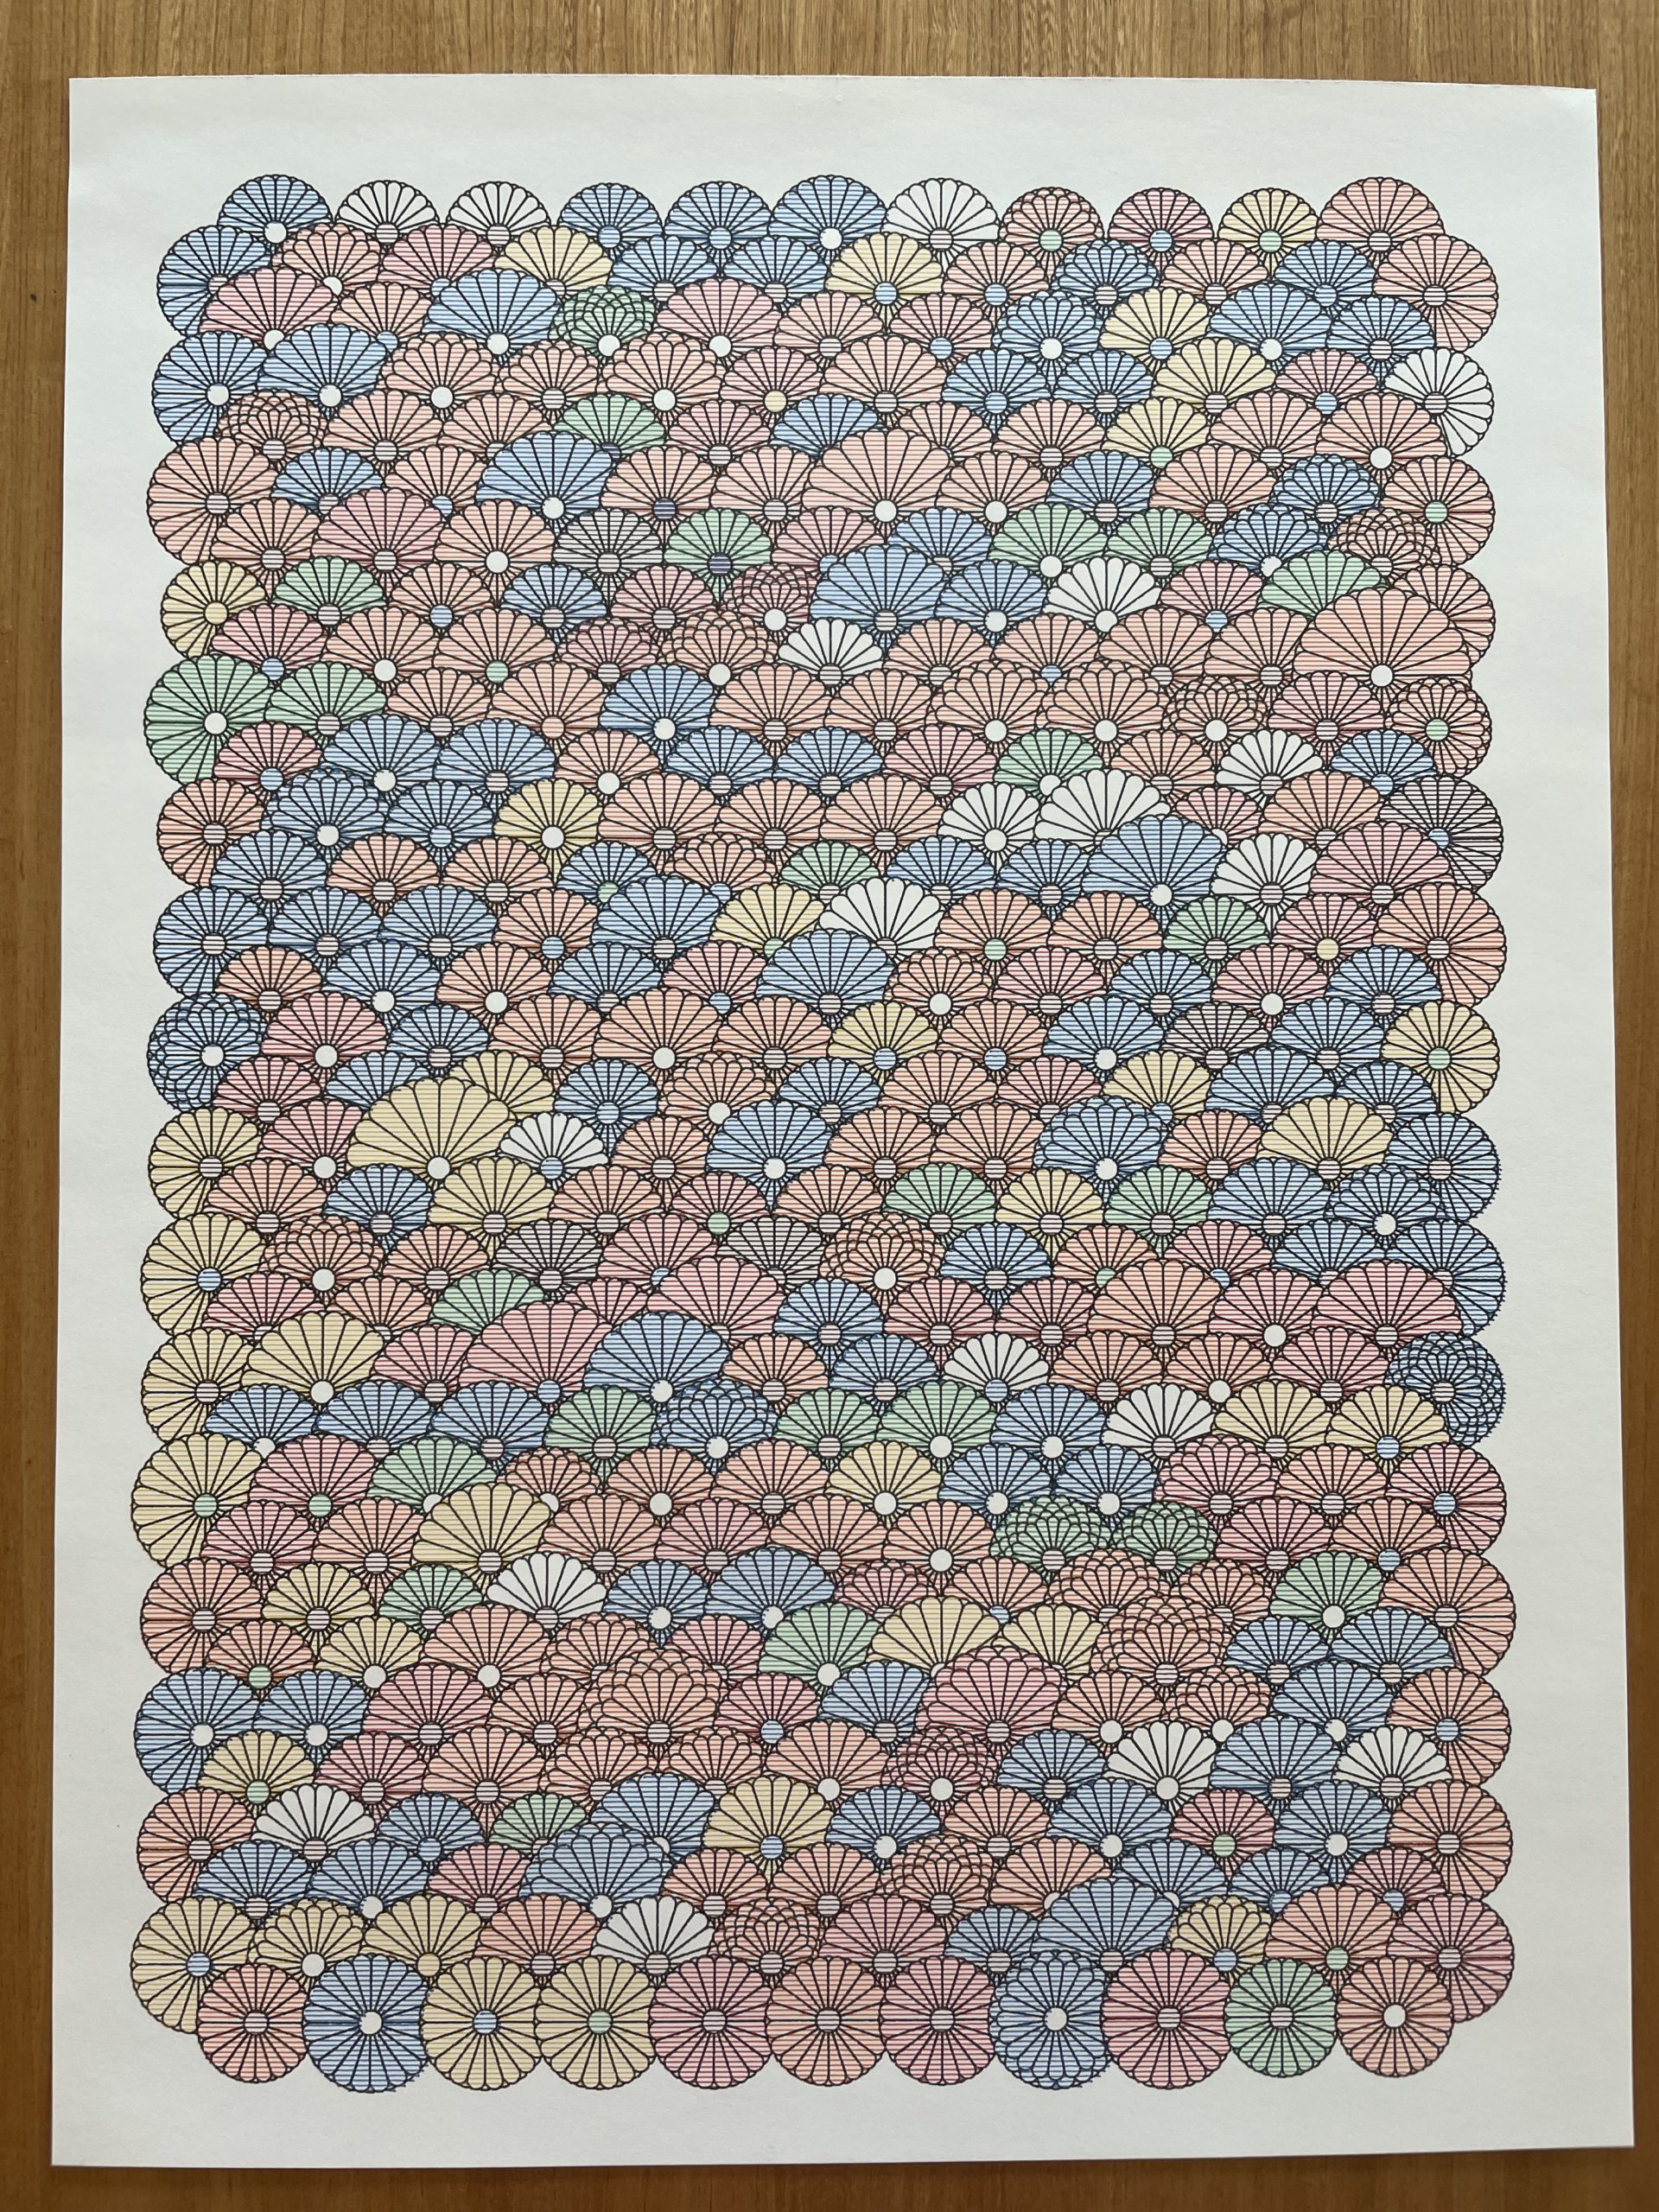
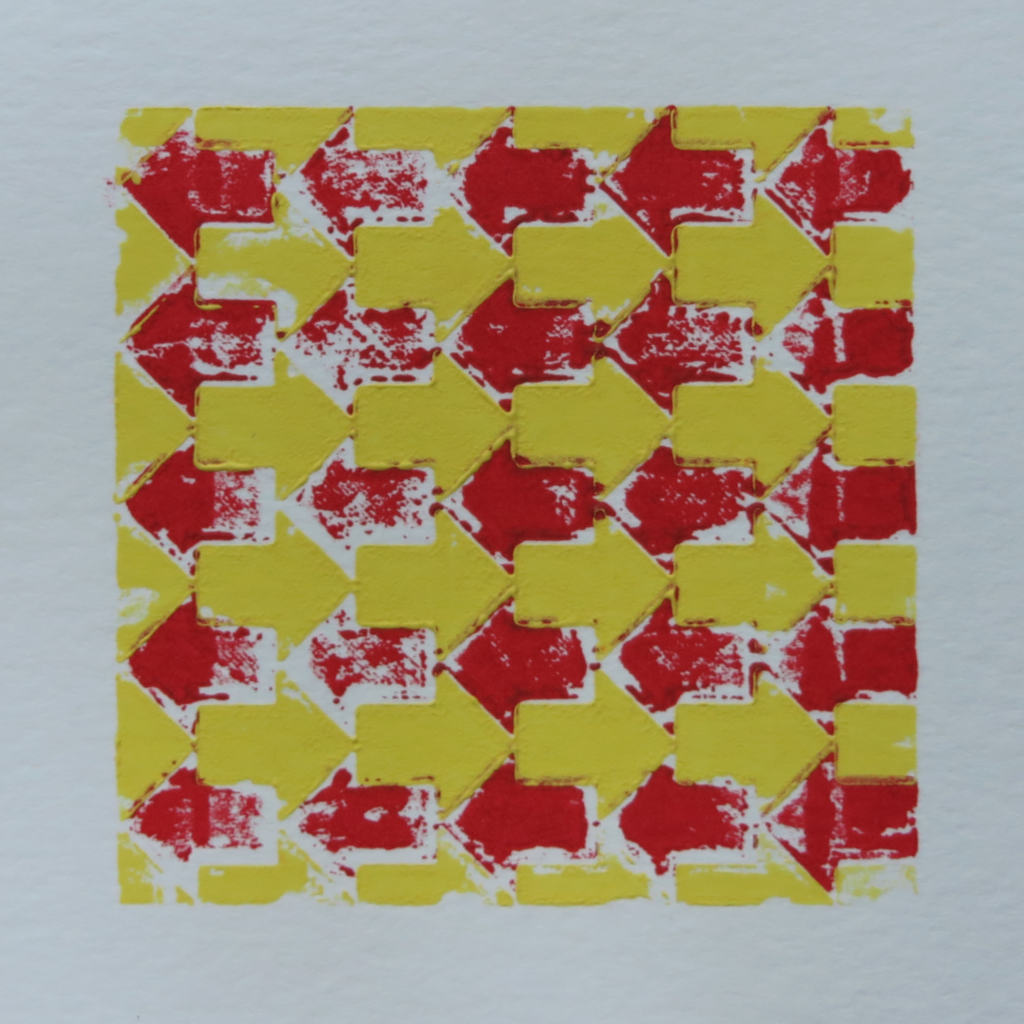
This drawing is made using data from the largest earthquake every day for 379 days. The magnitude, depth, and continent that it occurred on are utilized. The intent is not to visualize the data for evaluation, but use it as a composition element.
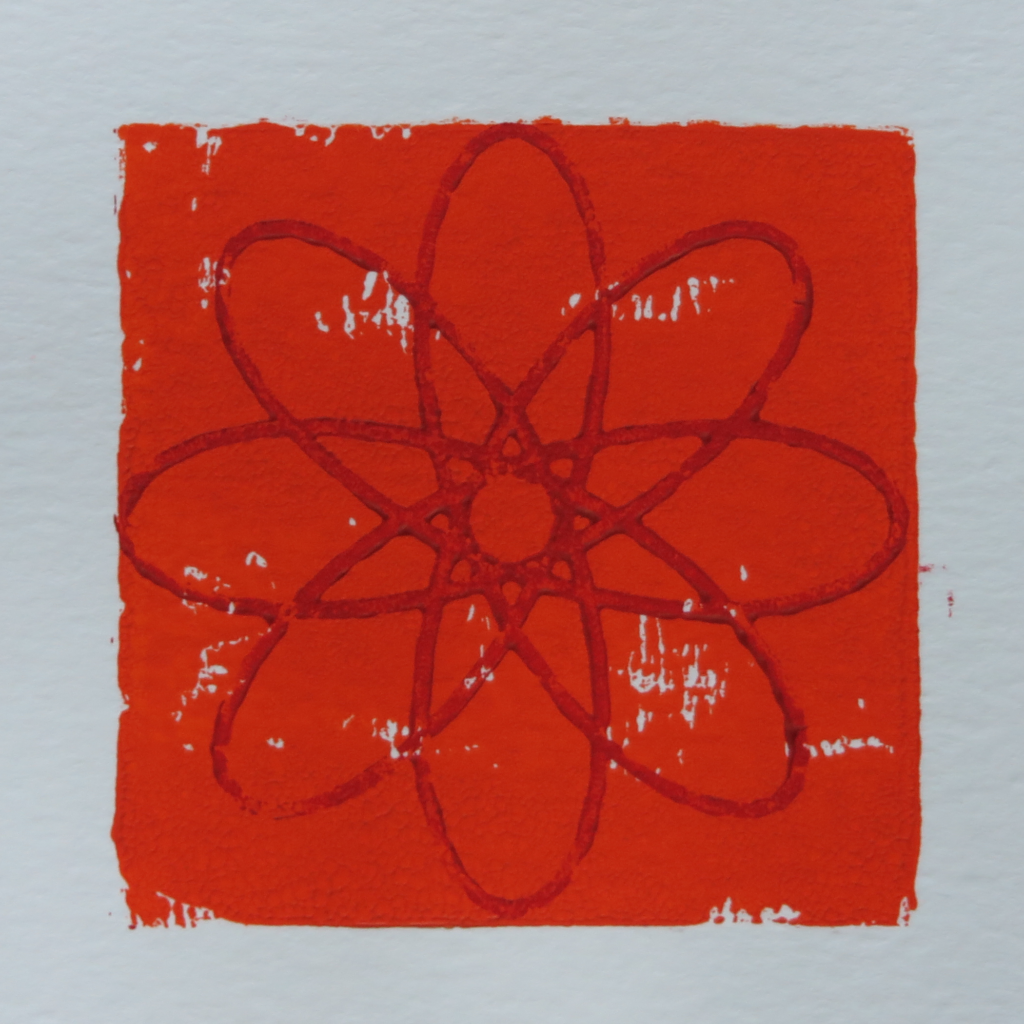
The flowers are inspired by a traditional Japanese textile pattern.

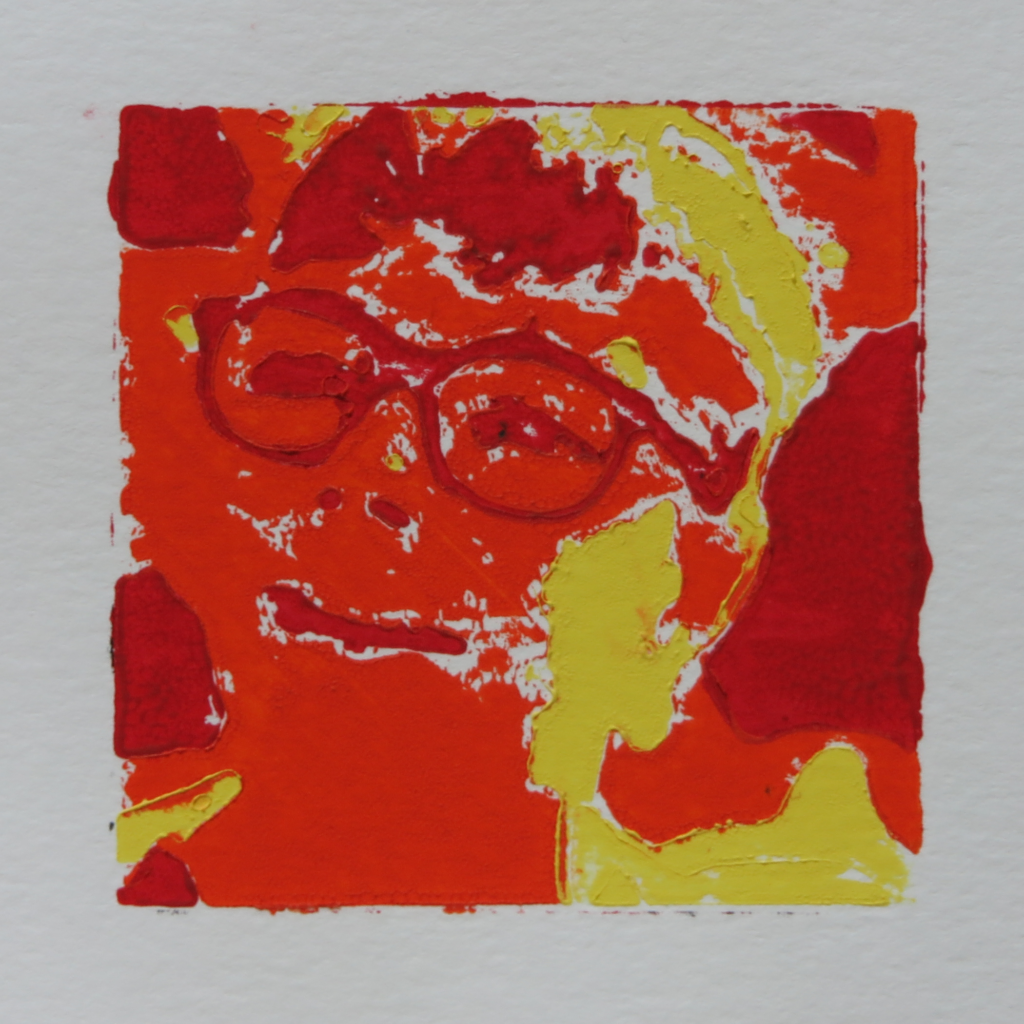
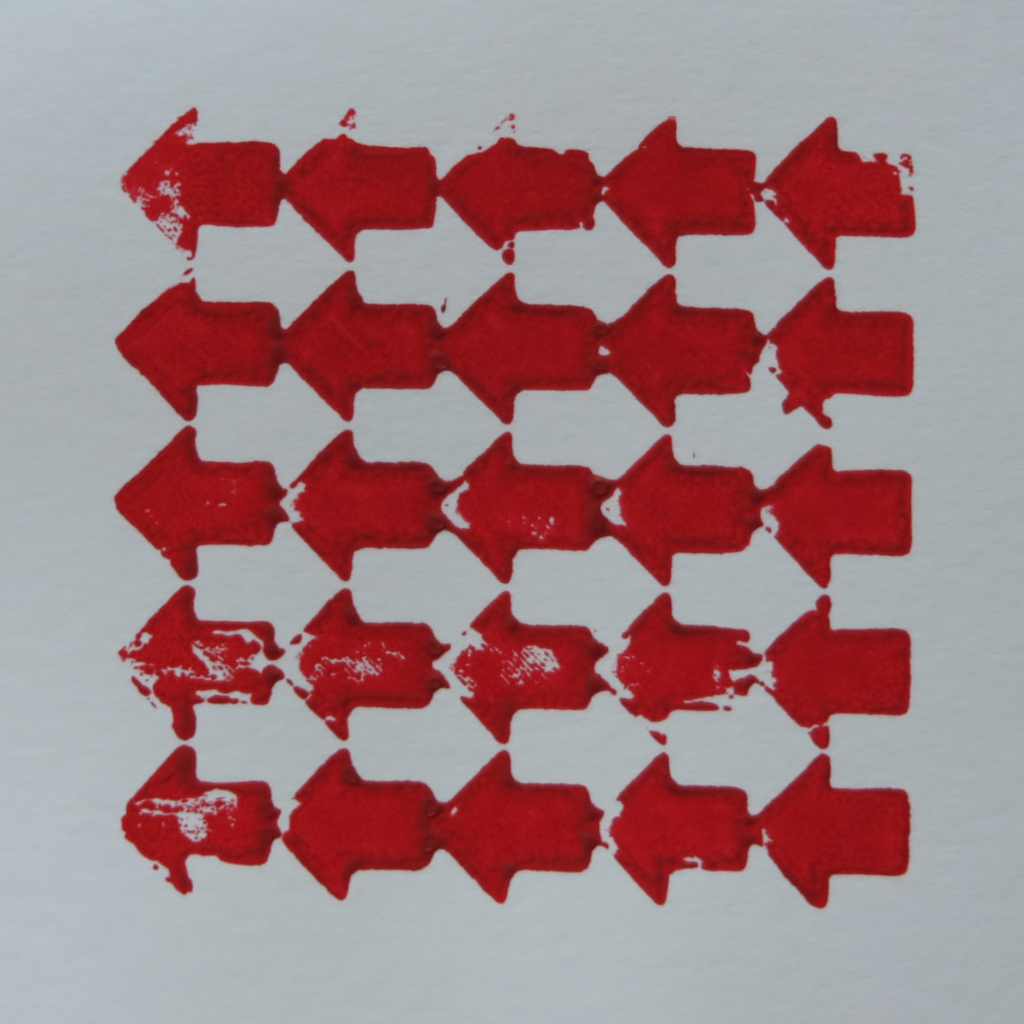
Photographs of block prints, each print 8cm square. They are made using 3d printed blocks. The designs are generated using code written in Python.


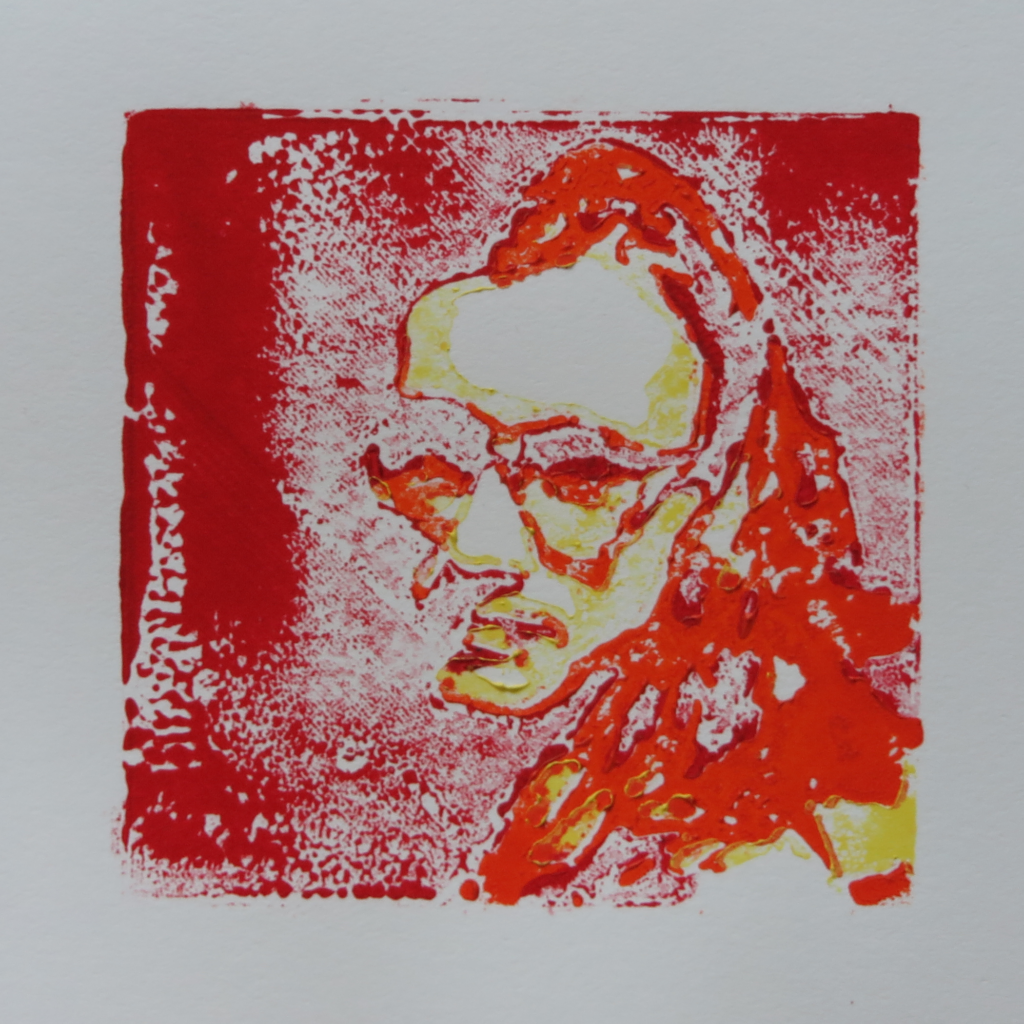


These final two images show some of the inked blocks and a print in process with a jig to guid the align the blocks.
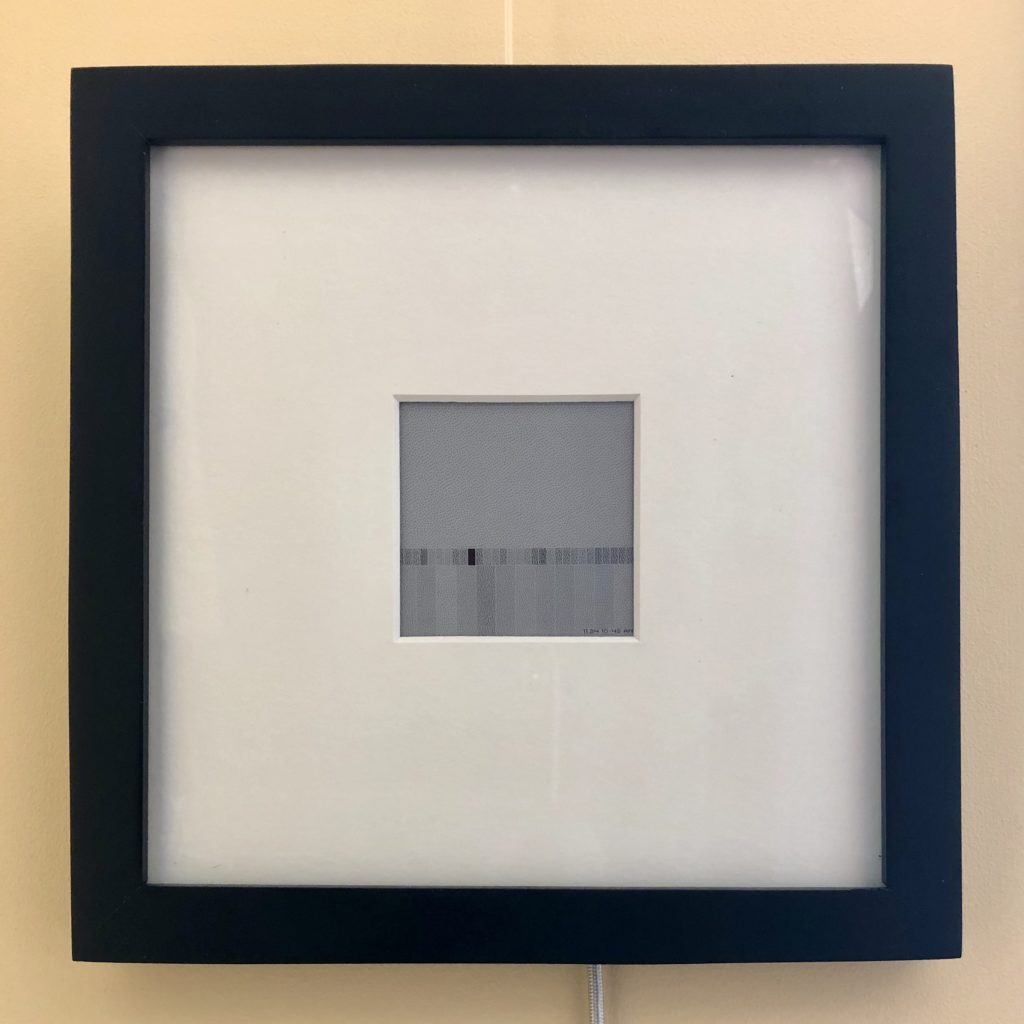
Visualization of earthquakes in the San Francisco Bay Area. Grey value indicates the magnitude of the most recent quake (top), all quakes in the past 24 hrs (bottom), and max quake each day for the past 30 days (middle).
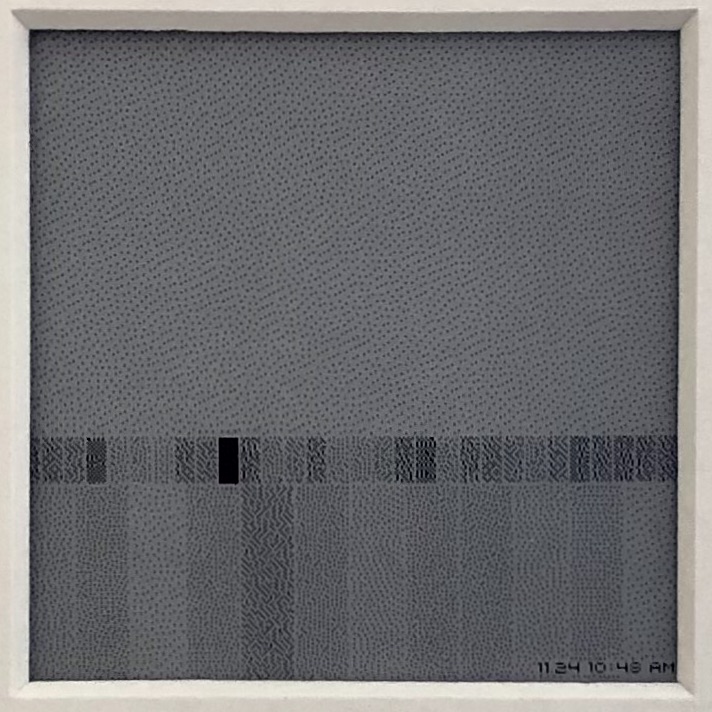
Made using a Raspberry Pi Zero W and a Pimoroni Inky wHAT, mounted in an 8 inch square frame.