A couple times in the pass, I have looked into ways to algorithmically generate lines suitable for plotting based on an image. Now that I have finally built a plotter to test them out, I decided to take another pass.
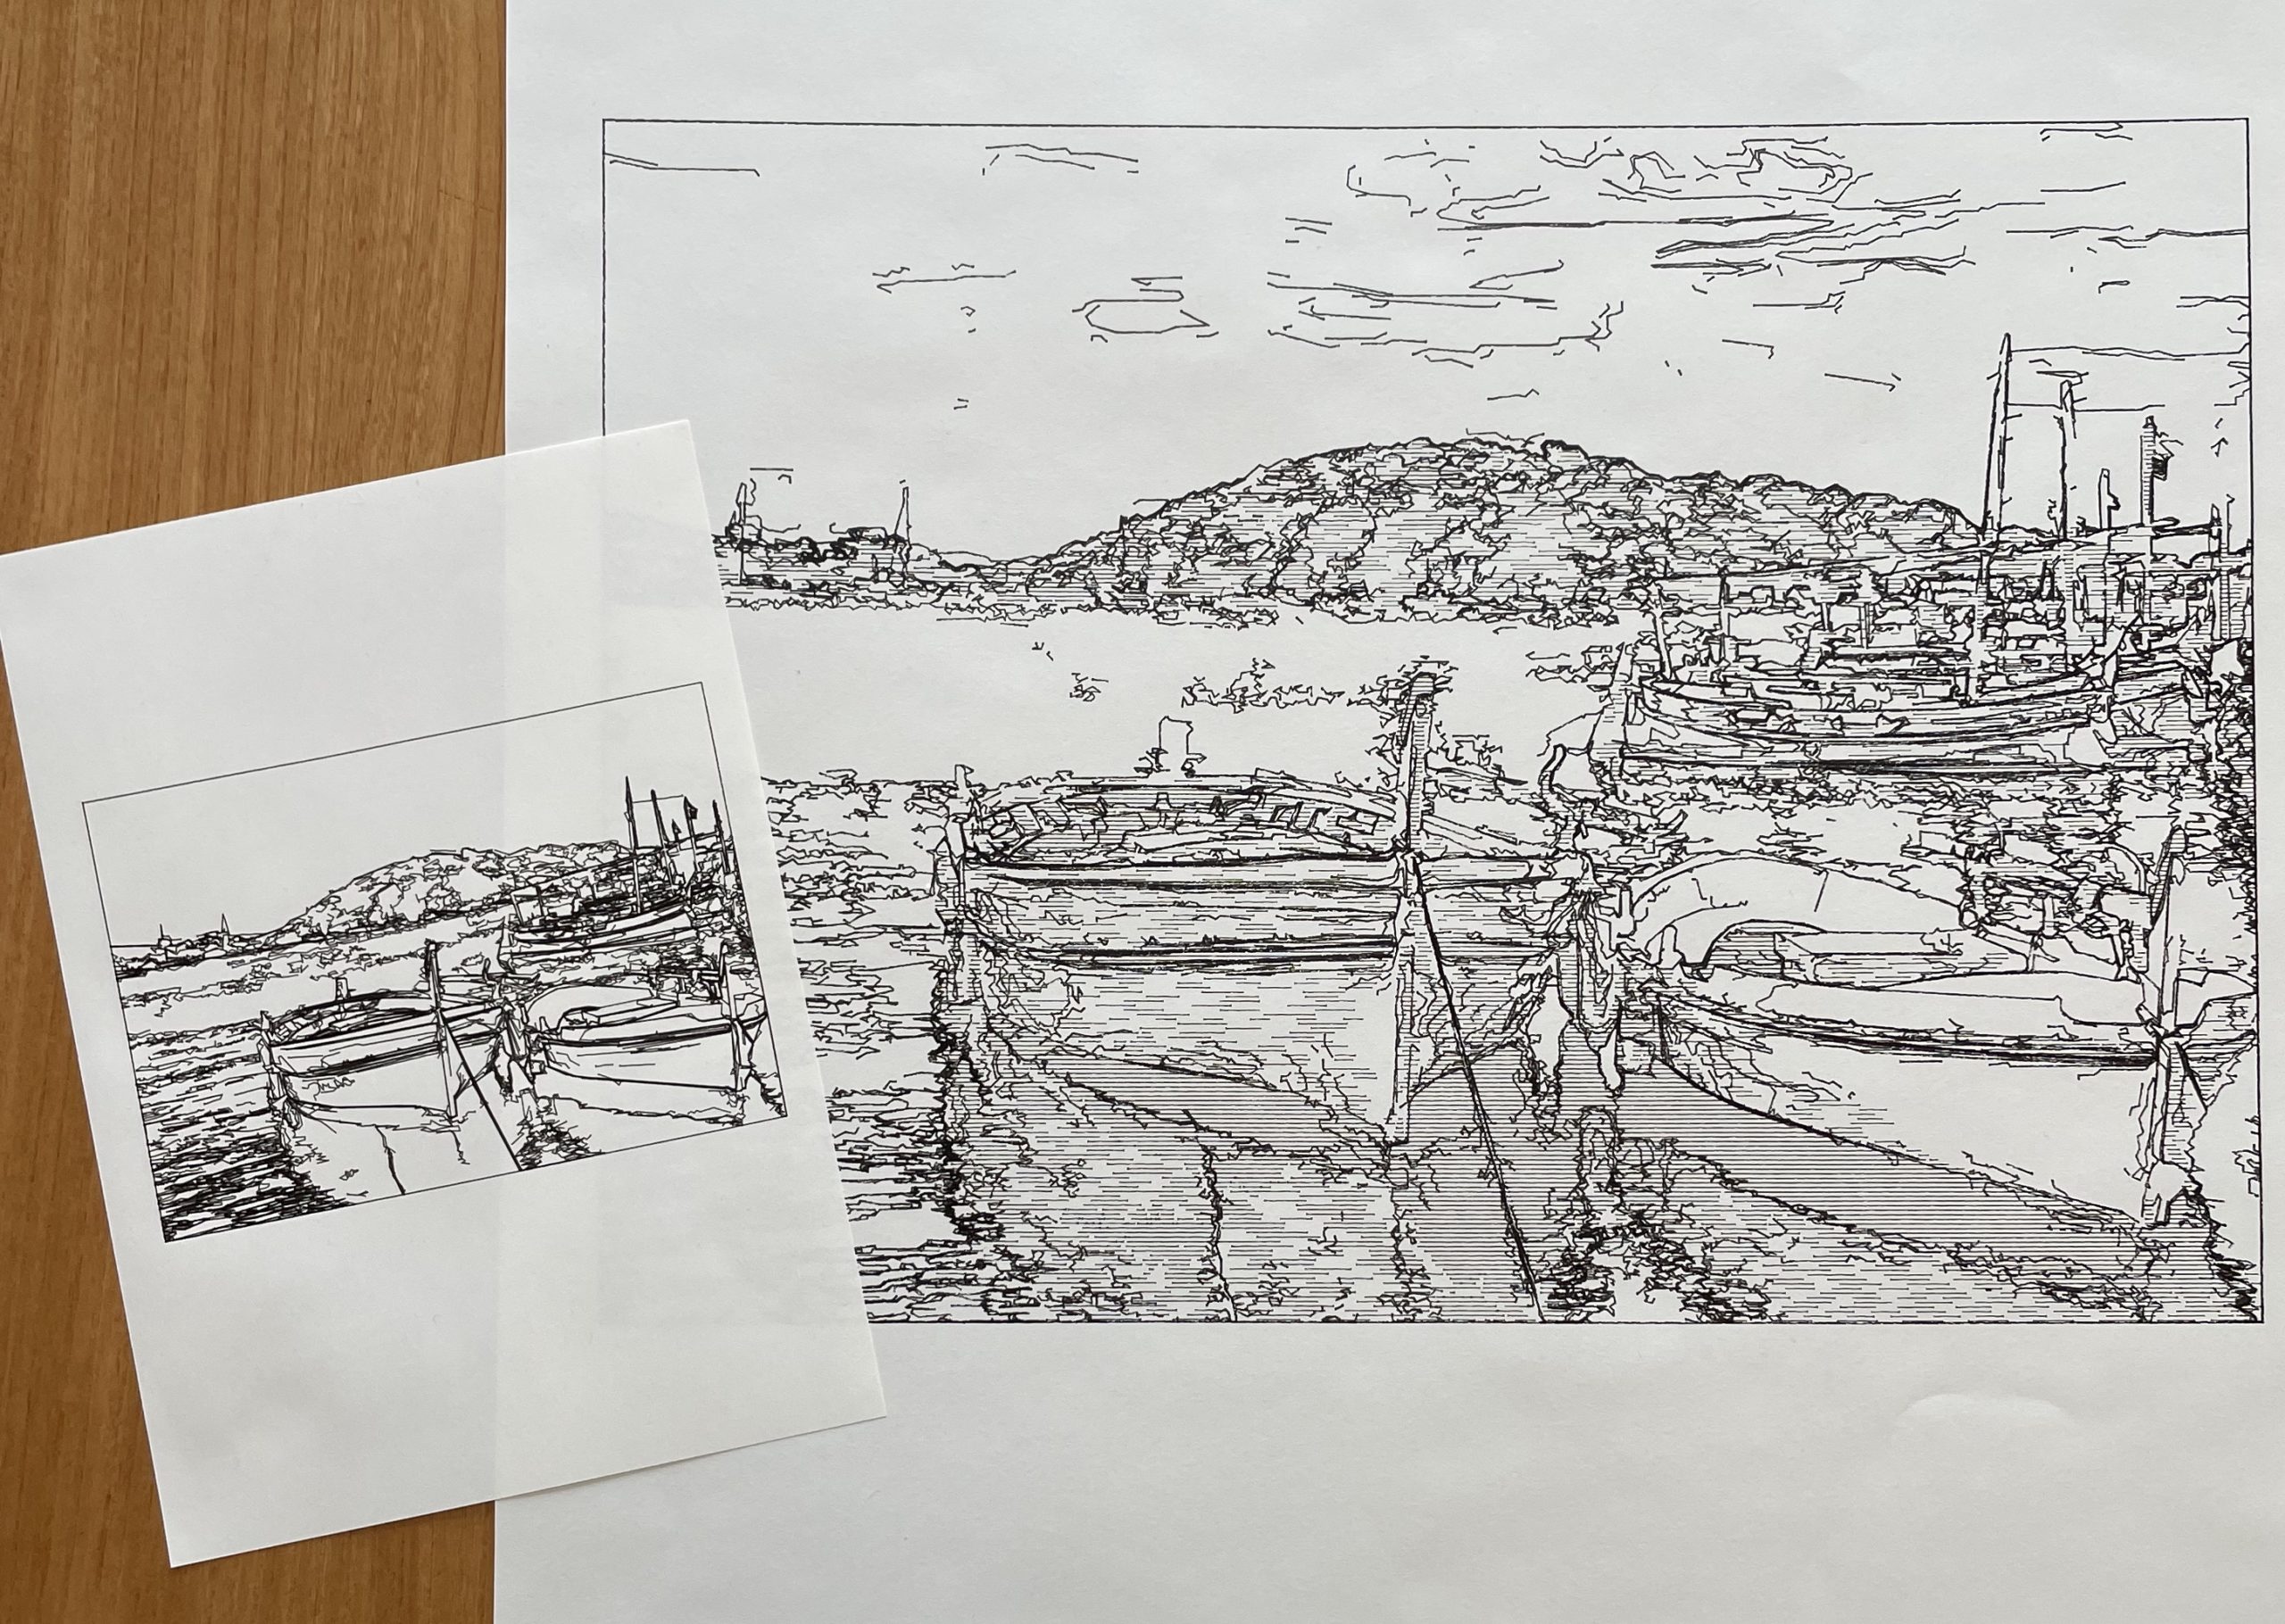
As in previous cases, I started with OpenCV contours generated from threshold images, as seen in the image below.

As it is, there is something compelling about this, but there is a lot of noise. The areas of the image where the contour lines stack up close to each other are areas where the brightness of the image change quickly. My assumption what that these represent good lines to focus on for the illustration and my first step was to filter out the other lines. Below is the result of keeping only points that are within a set range of another point. I also remove any of those points within range if they are really close to the point I am keeping. The ideal distances to use for this vary from image to image, but I was interested to see if there were some settings that worked fairly well for a variety of image. The image below is the result of these generic settings that work across many images.

There are still quite a few extra lines here, so I wrote a few more filters to remove particularly jaggy points from the lines, remaining remaining fragments that are really short. Next, I merged any lines whose endpoints were particularly close to each other (to reduce unnecessary pen lifts) before making a final pass to remove lines that don’t much area of the illustration. The results of each of these filters is included below.


The final results are ok, but the number of paths is higher than I would like (263 paths in the example above). Filtering out more of the paths is possible, but key details start to get lost depending on the specific nature of the image being used. A genetic algorithm could be used to fine tune the filter settings for each image, or you could import the SVG into Inscape and just manually remove the lines you don’t like.
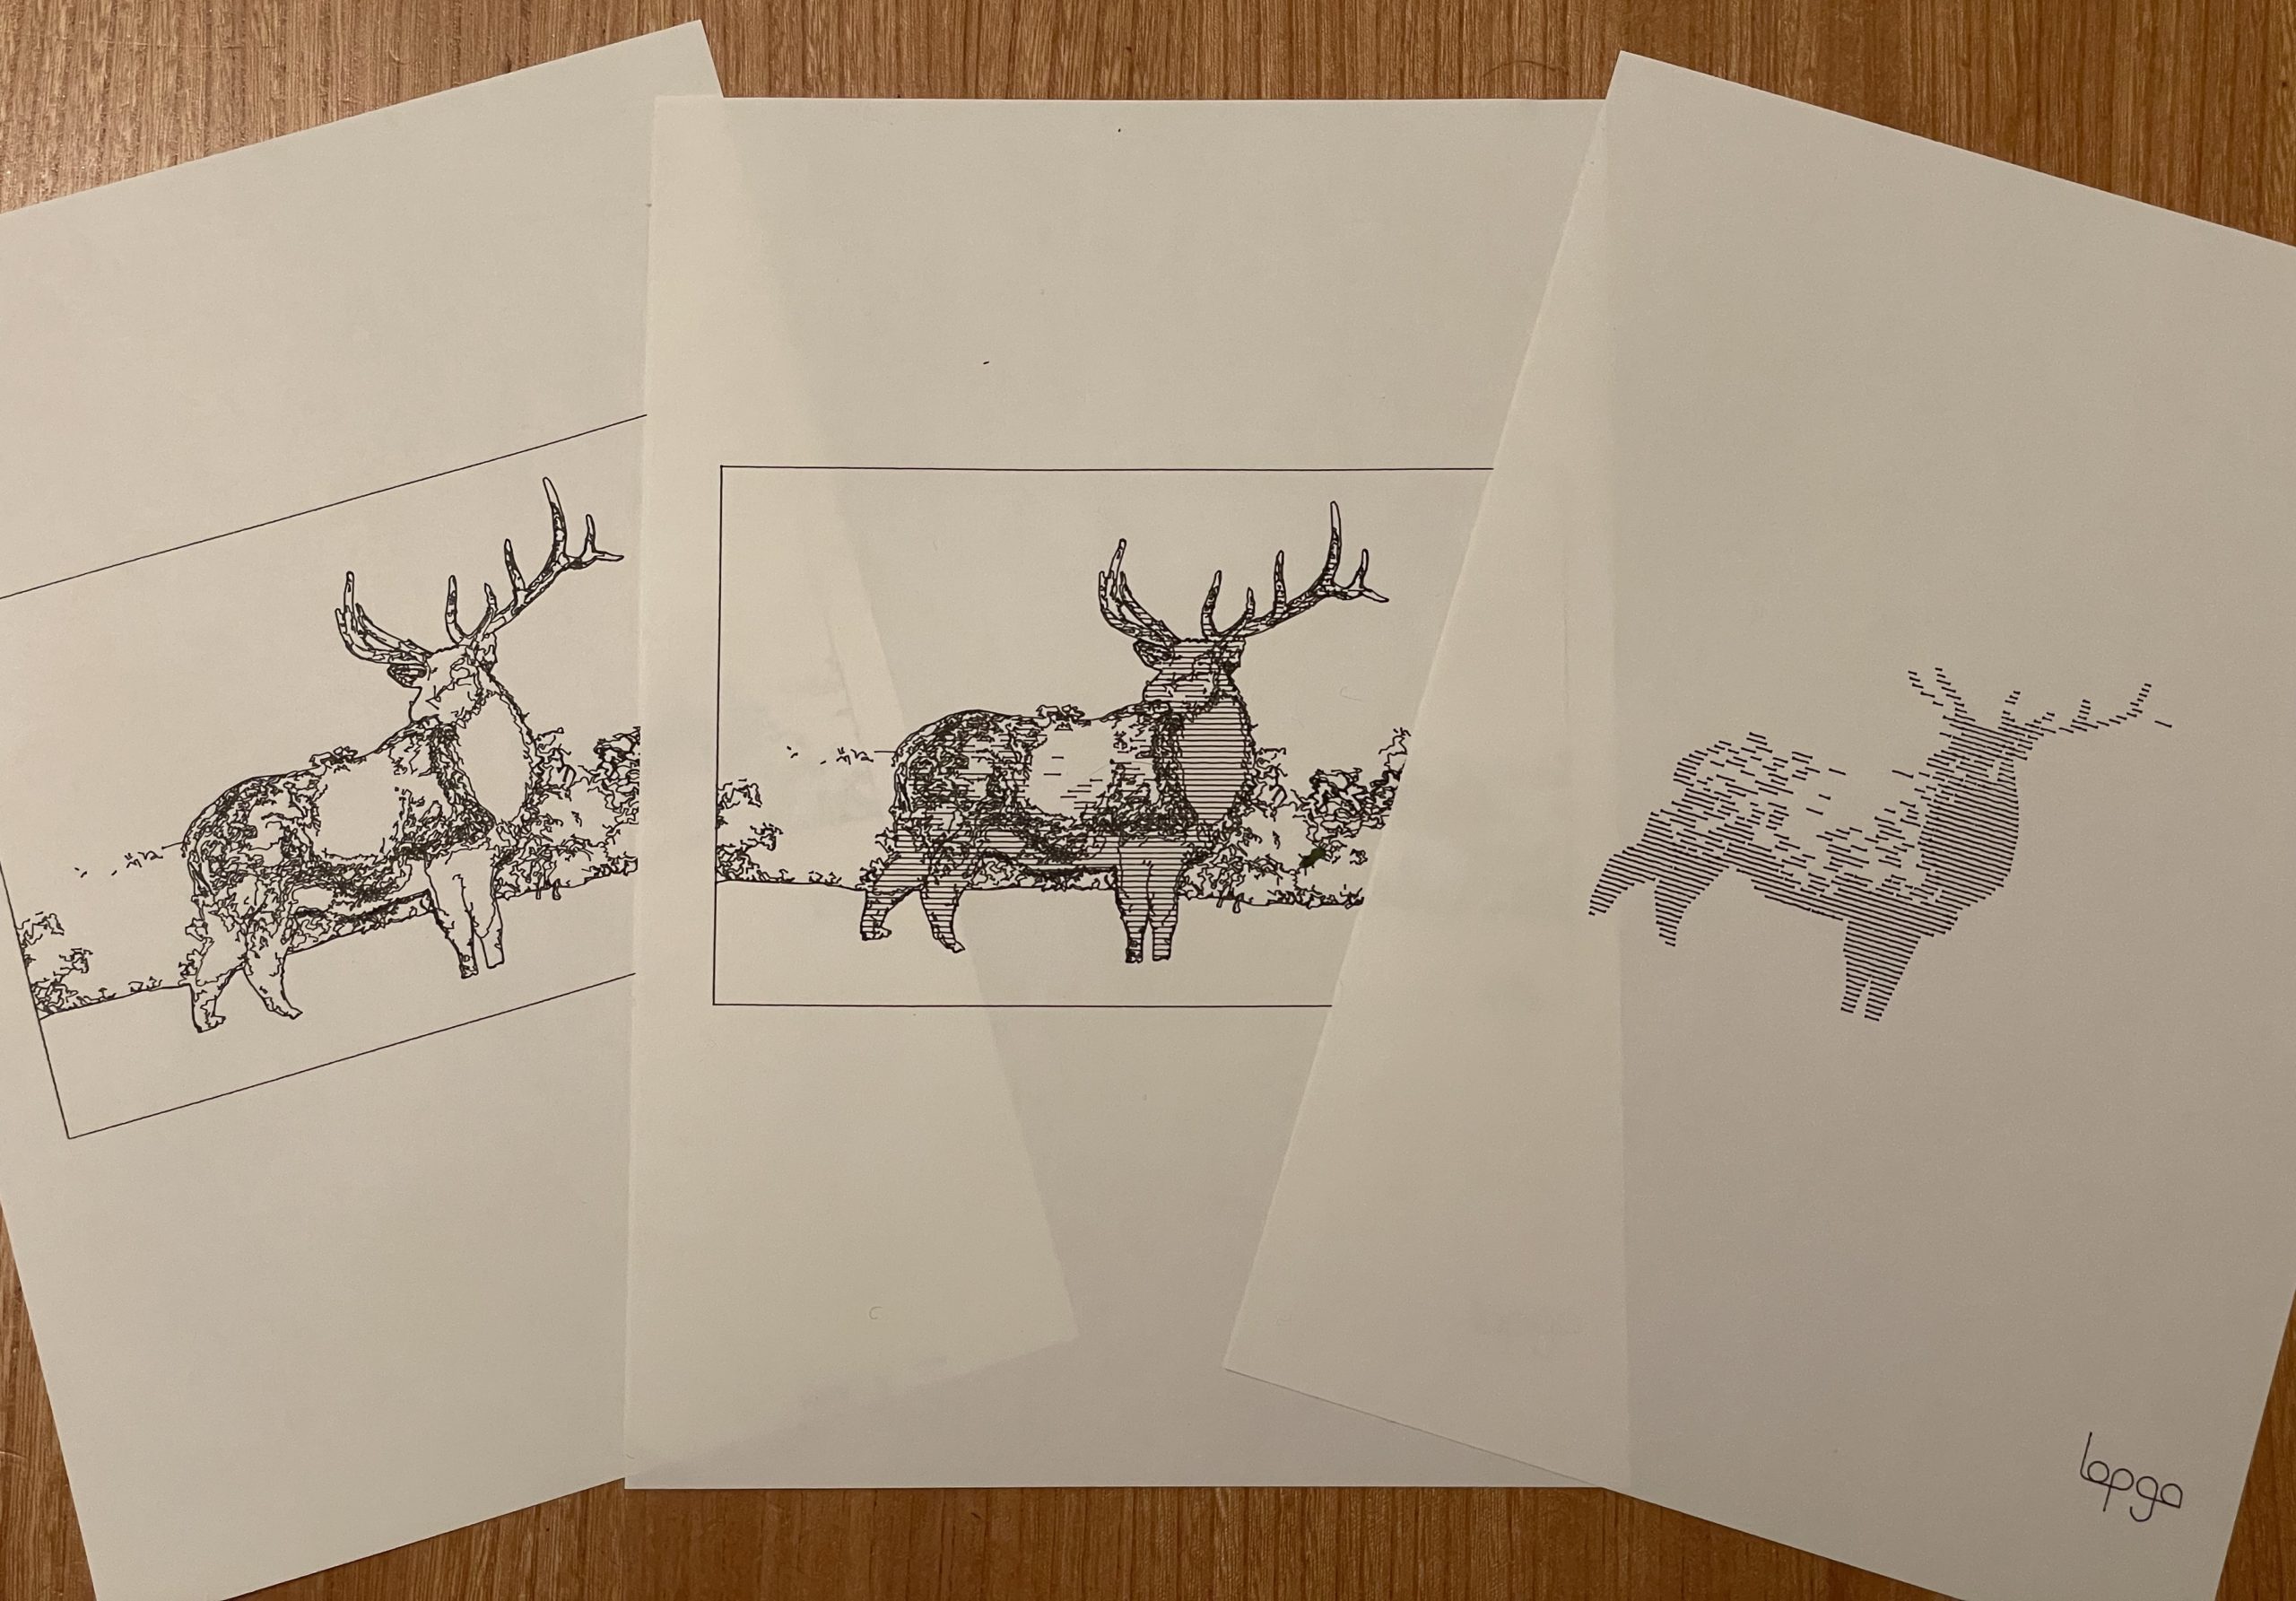
For now, I decided to toss in some some hatch shading and call it a successful experiment. Below are some plotted results with and without shading.