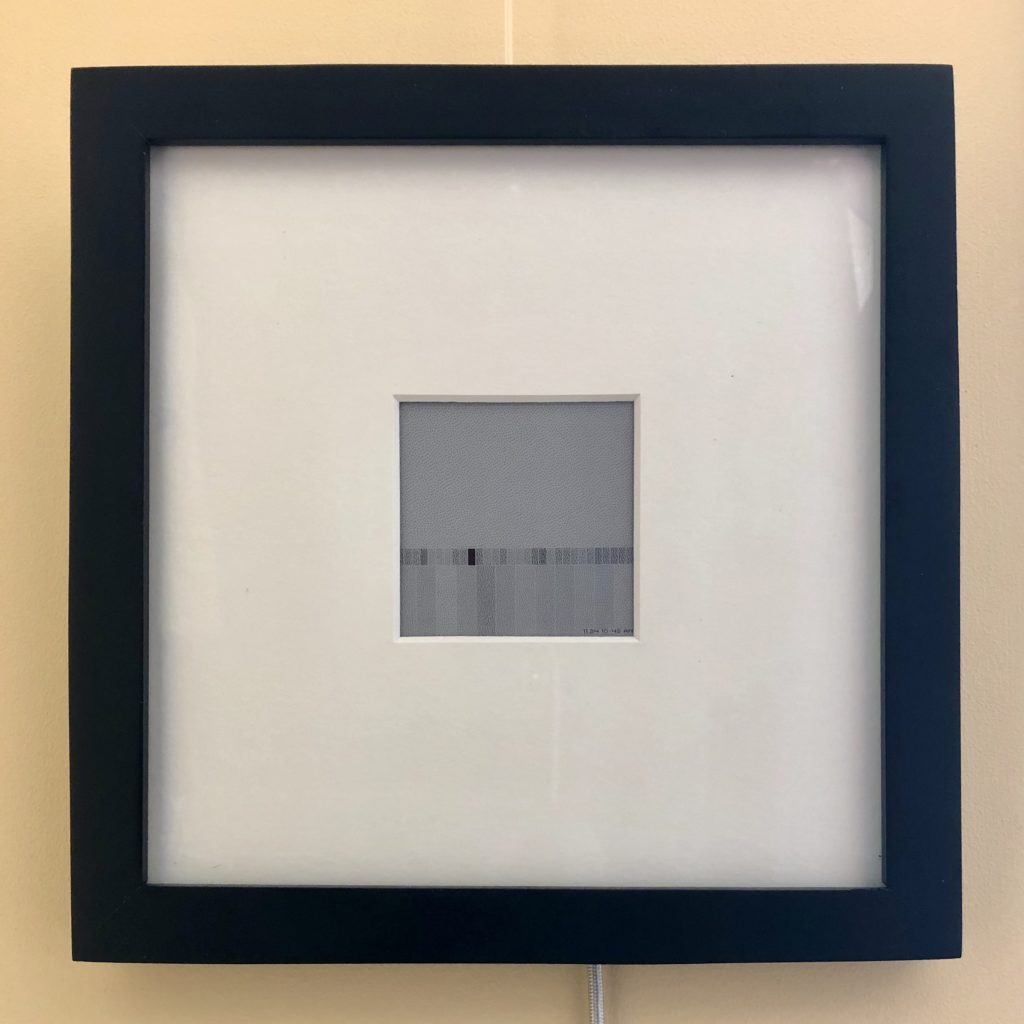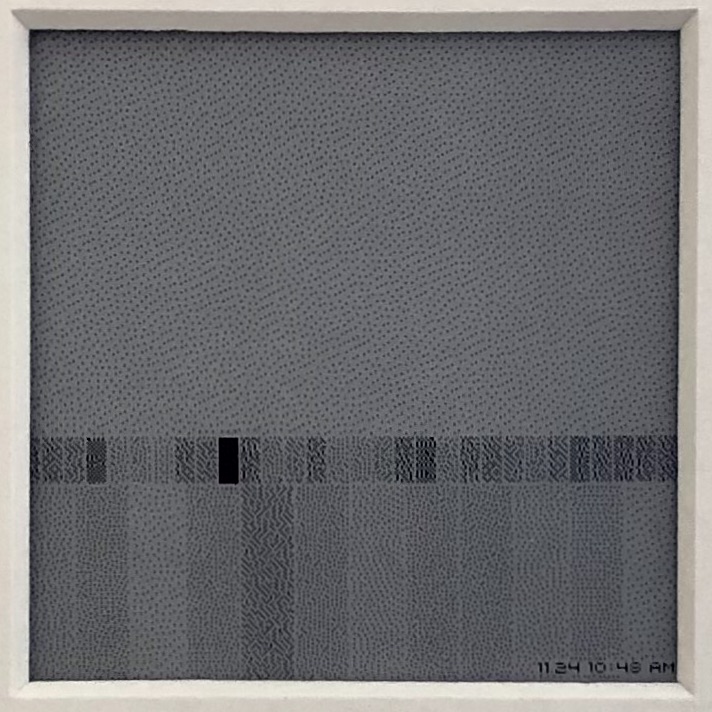
Visualization of earthquakes in the San Francisco Bay Area. Grey value indicates the magnitude of the most recent quake (top), all quakes in the past 24 hrs (bottom), and max quake each day for the past 30 days (middle).

Made using a Raspberry Pi Zero W and a Pimoroni Inky wHAT, mounted in an 8 inch square frame.