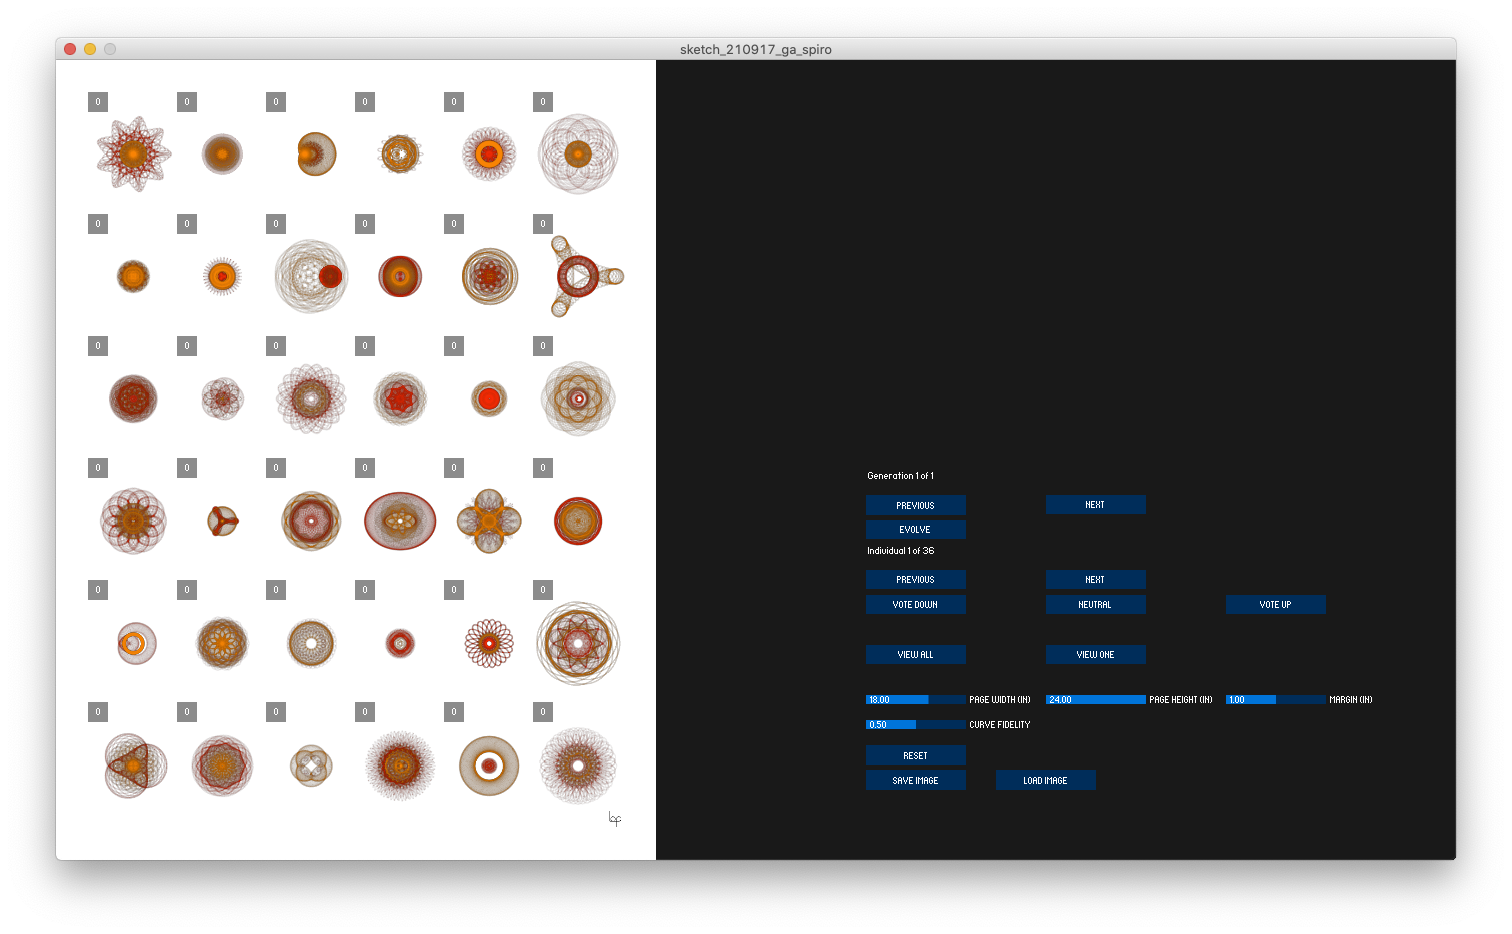
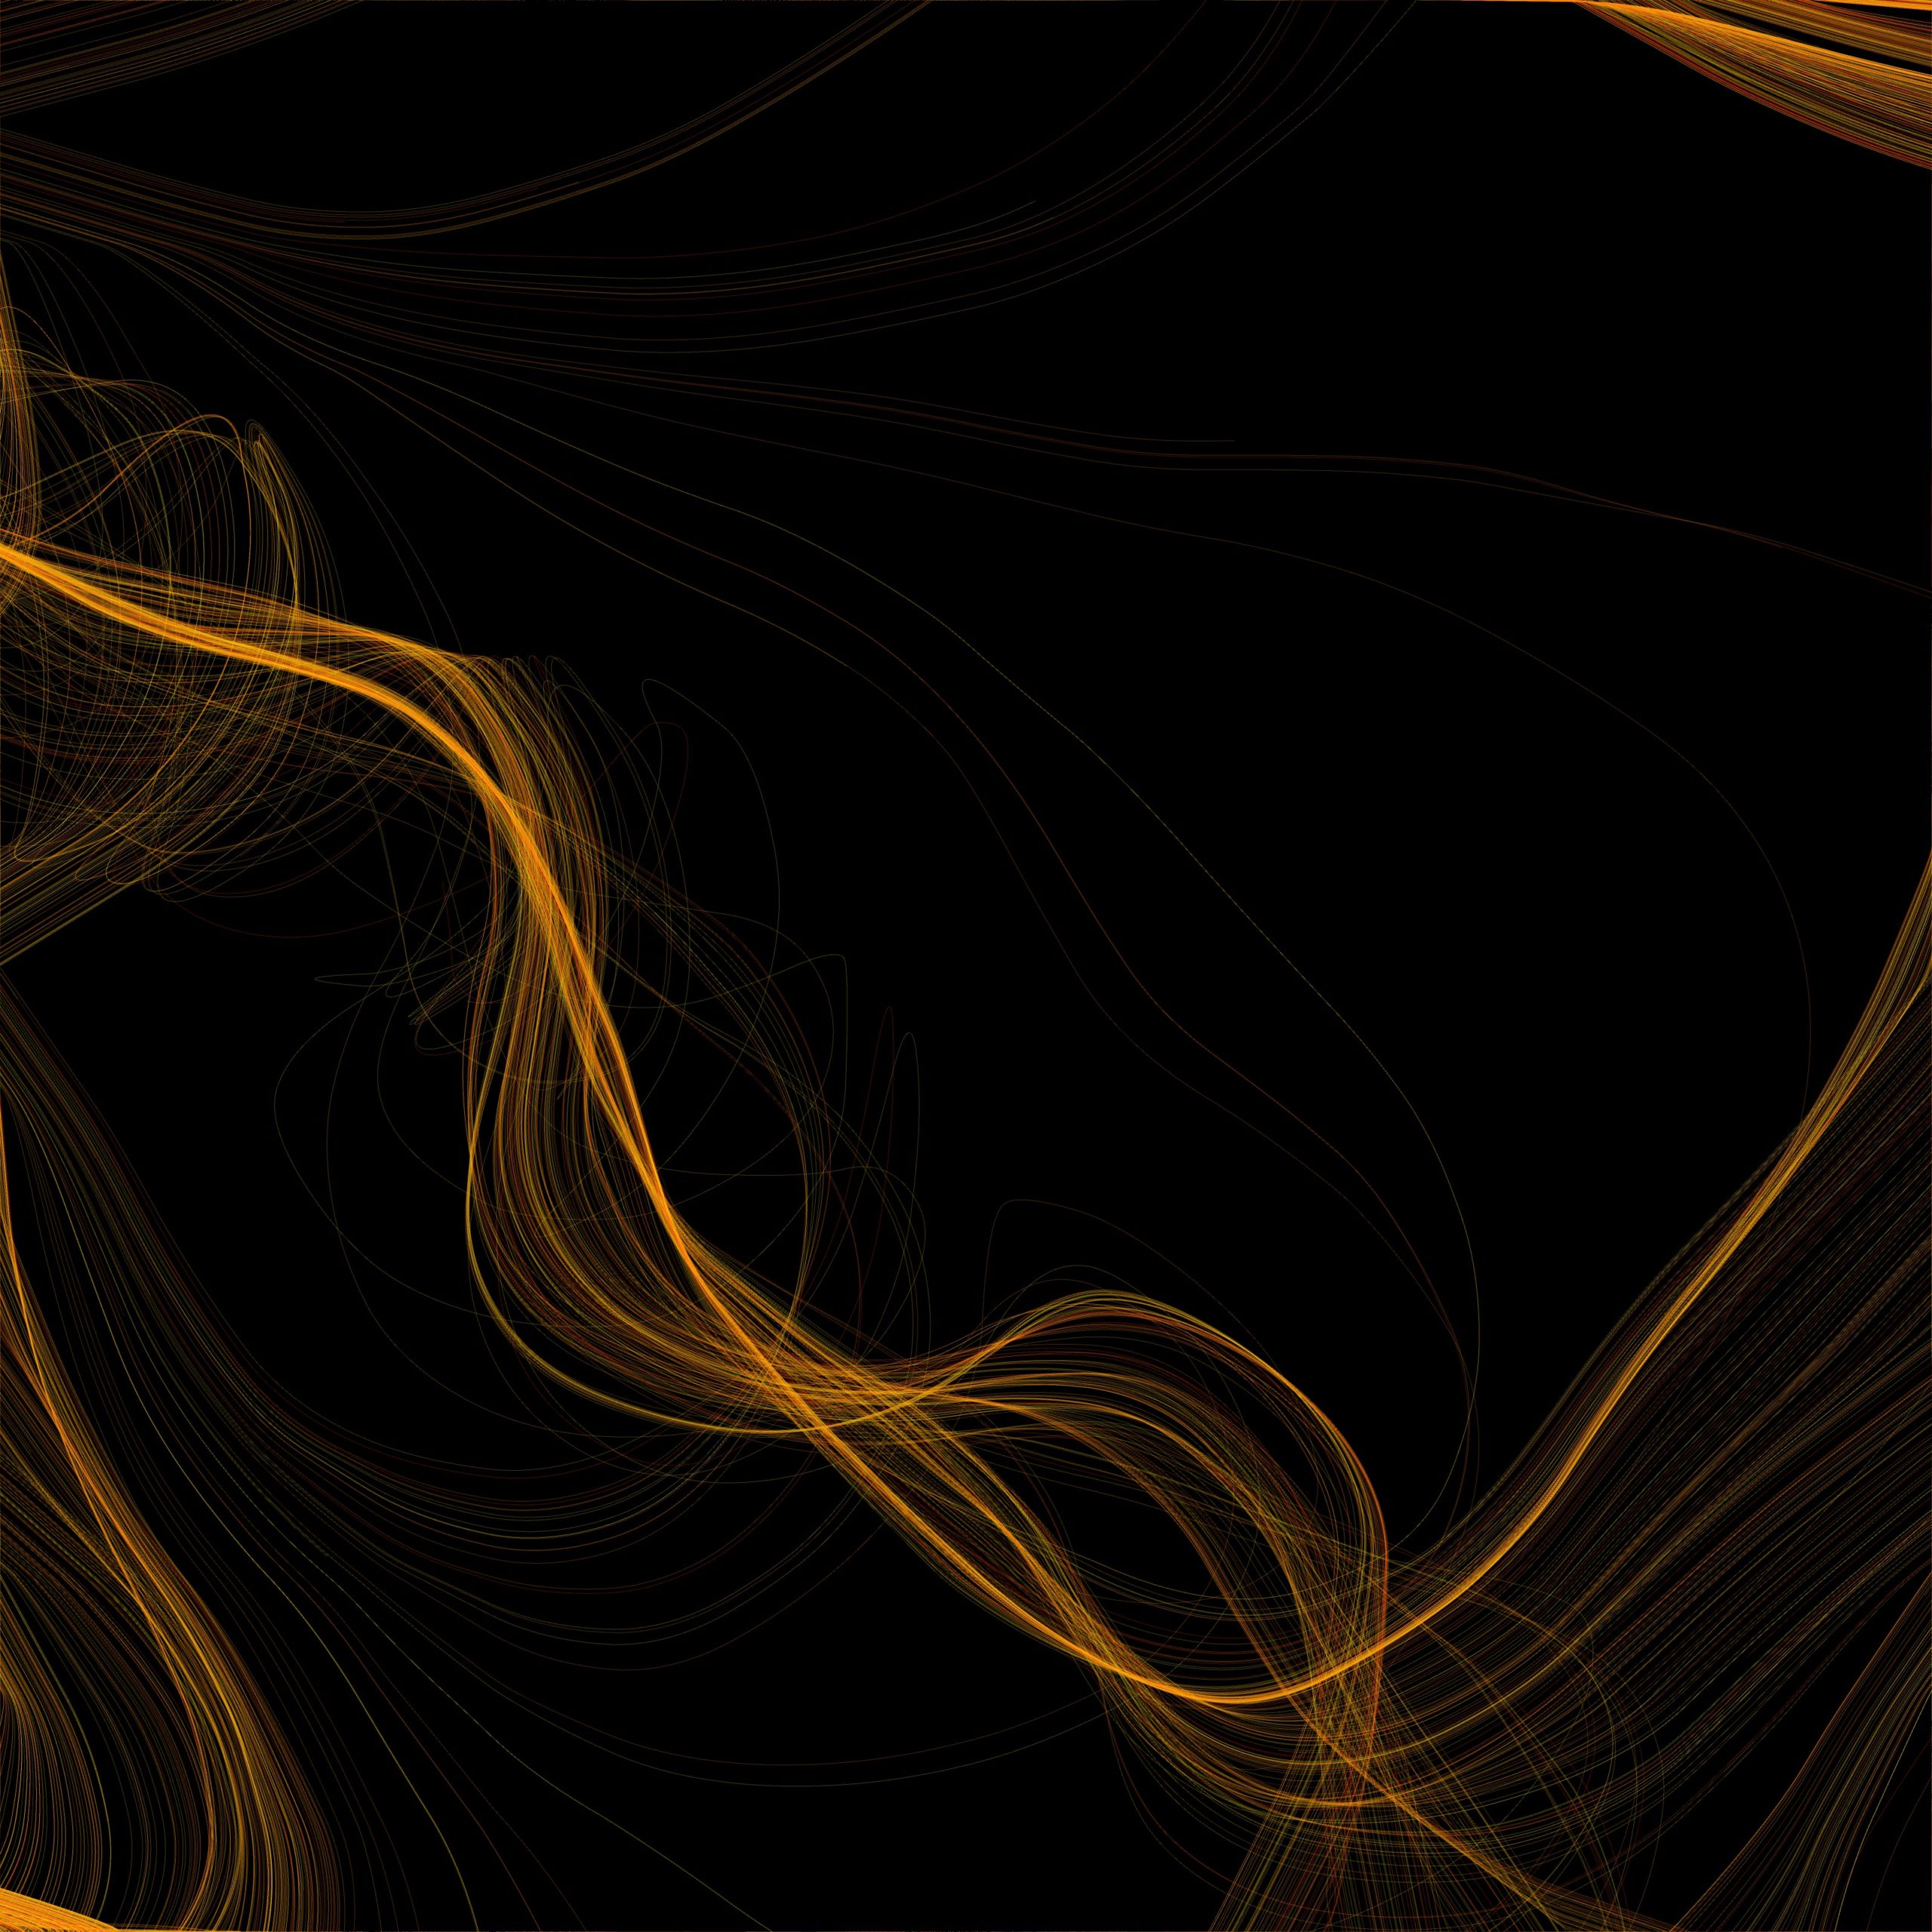
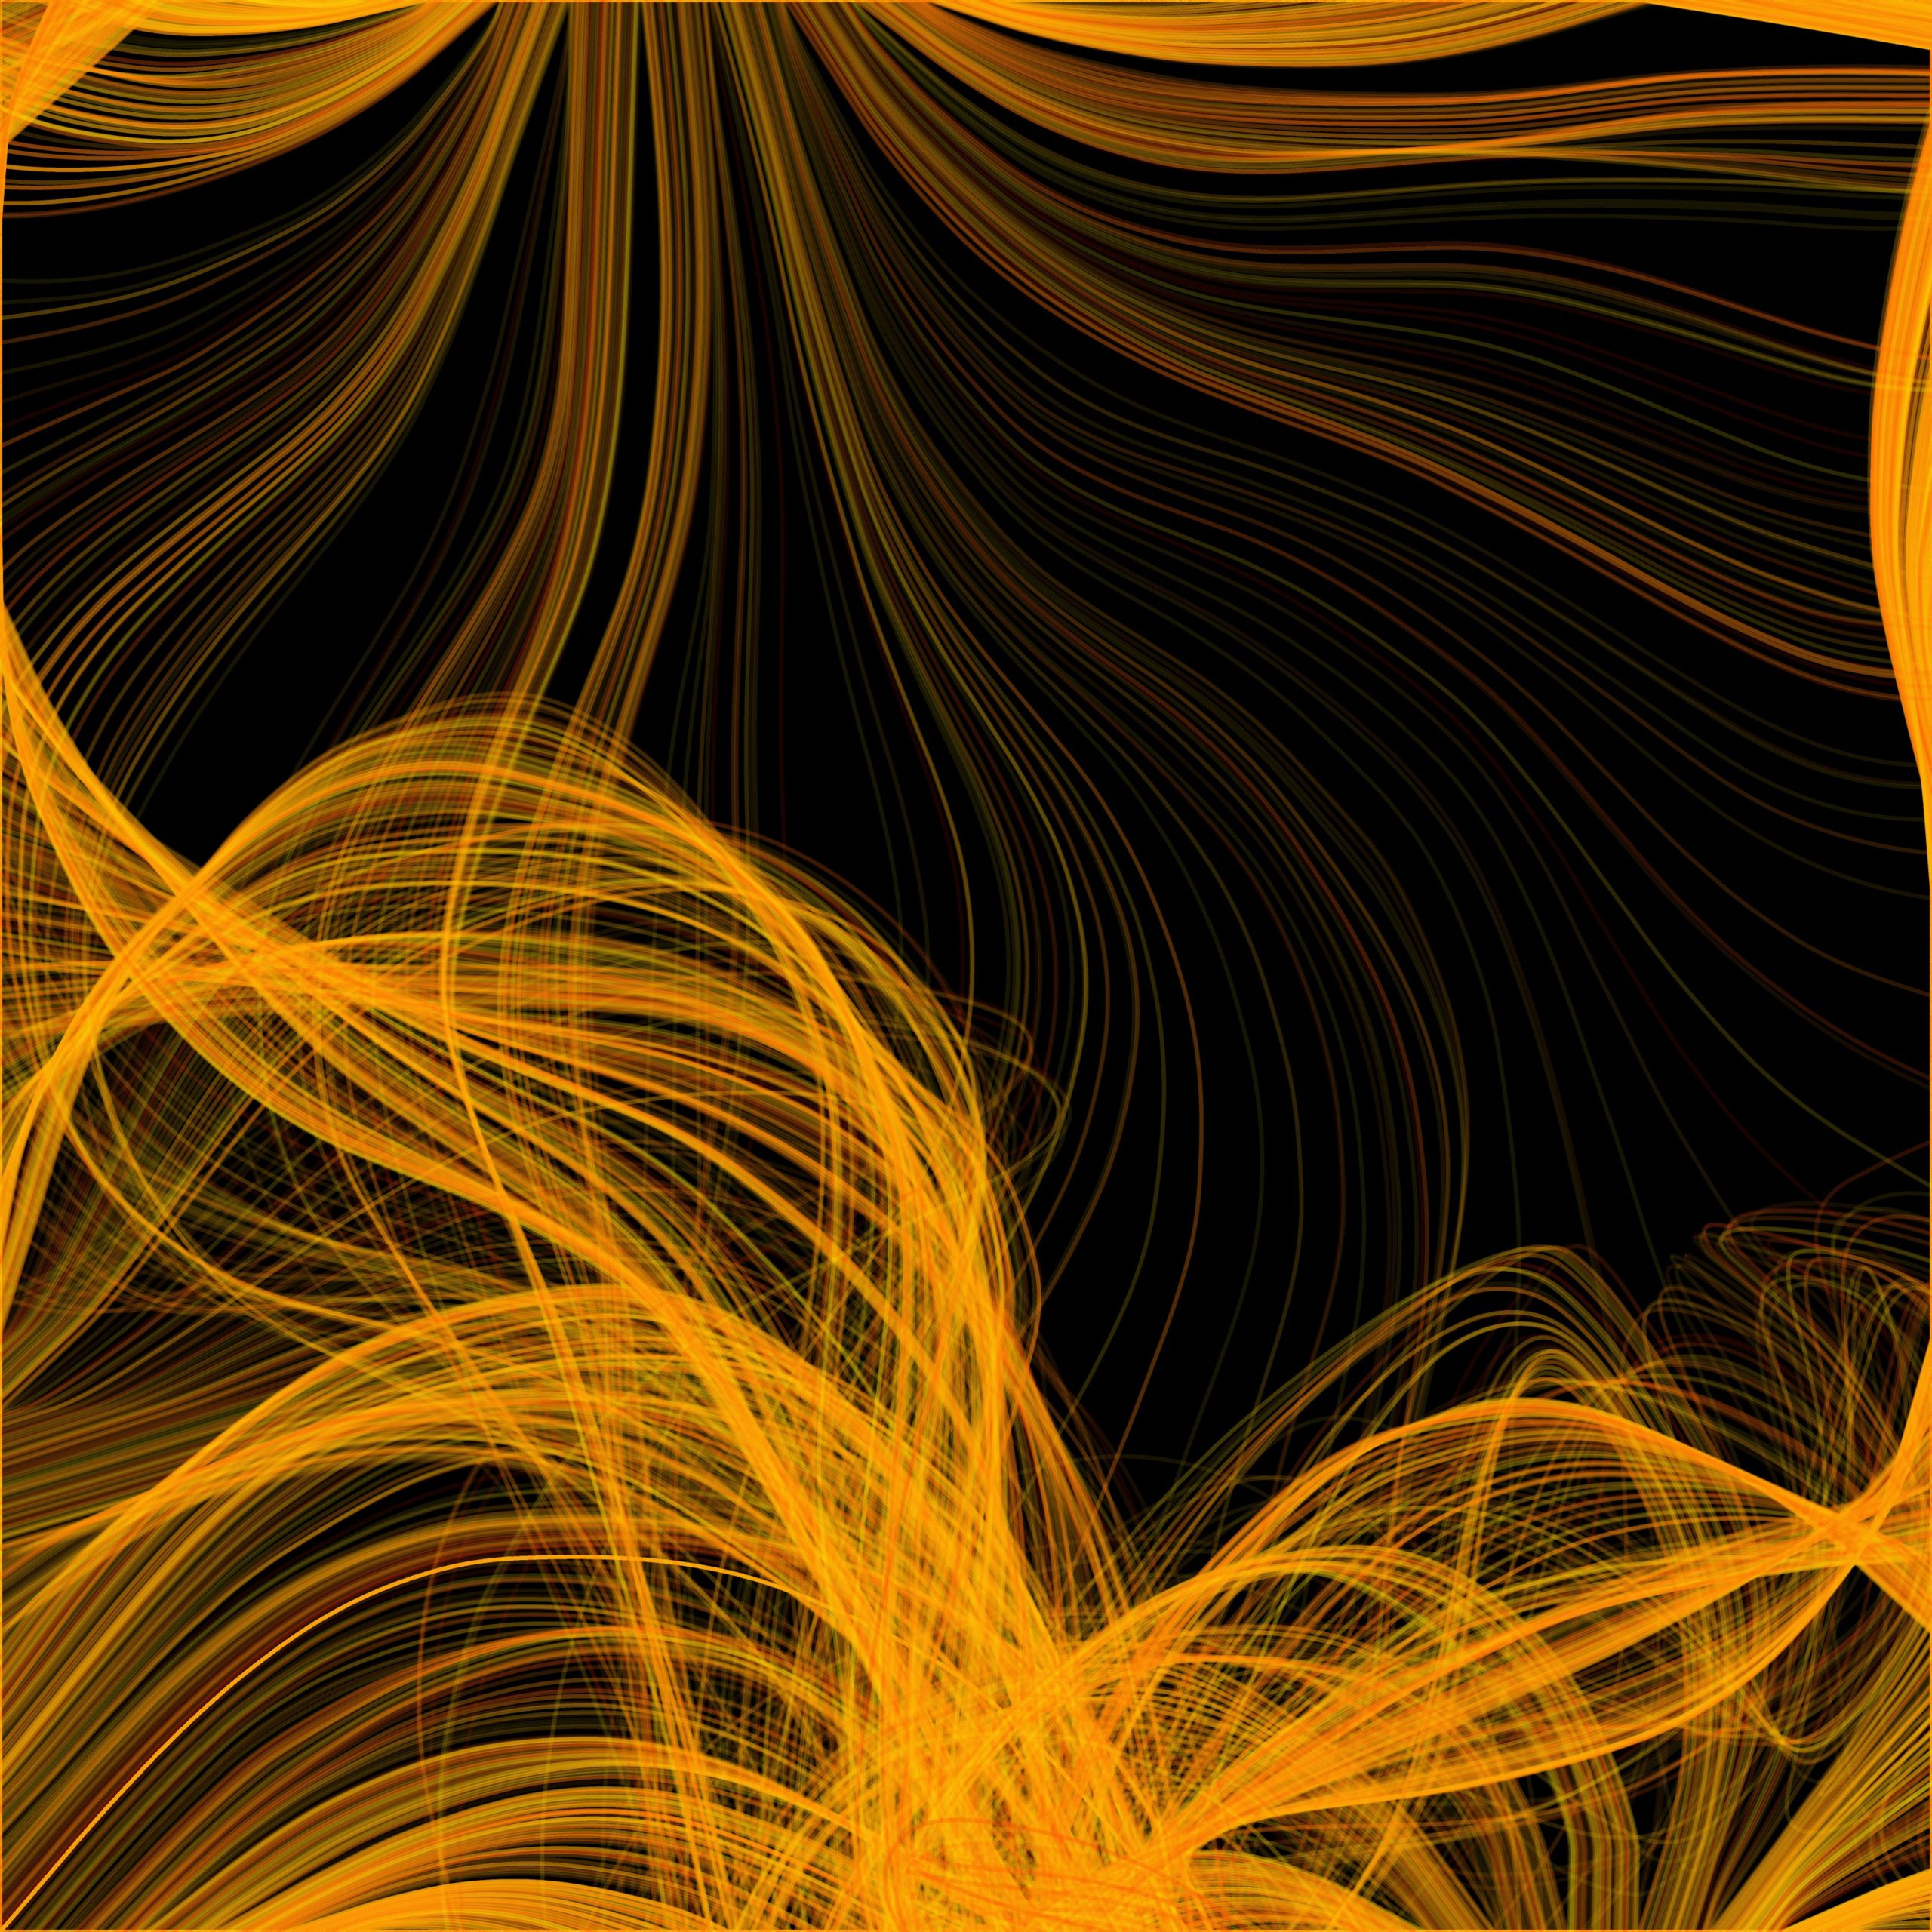
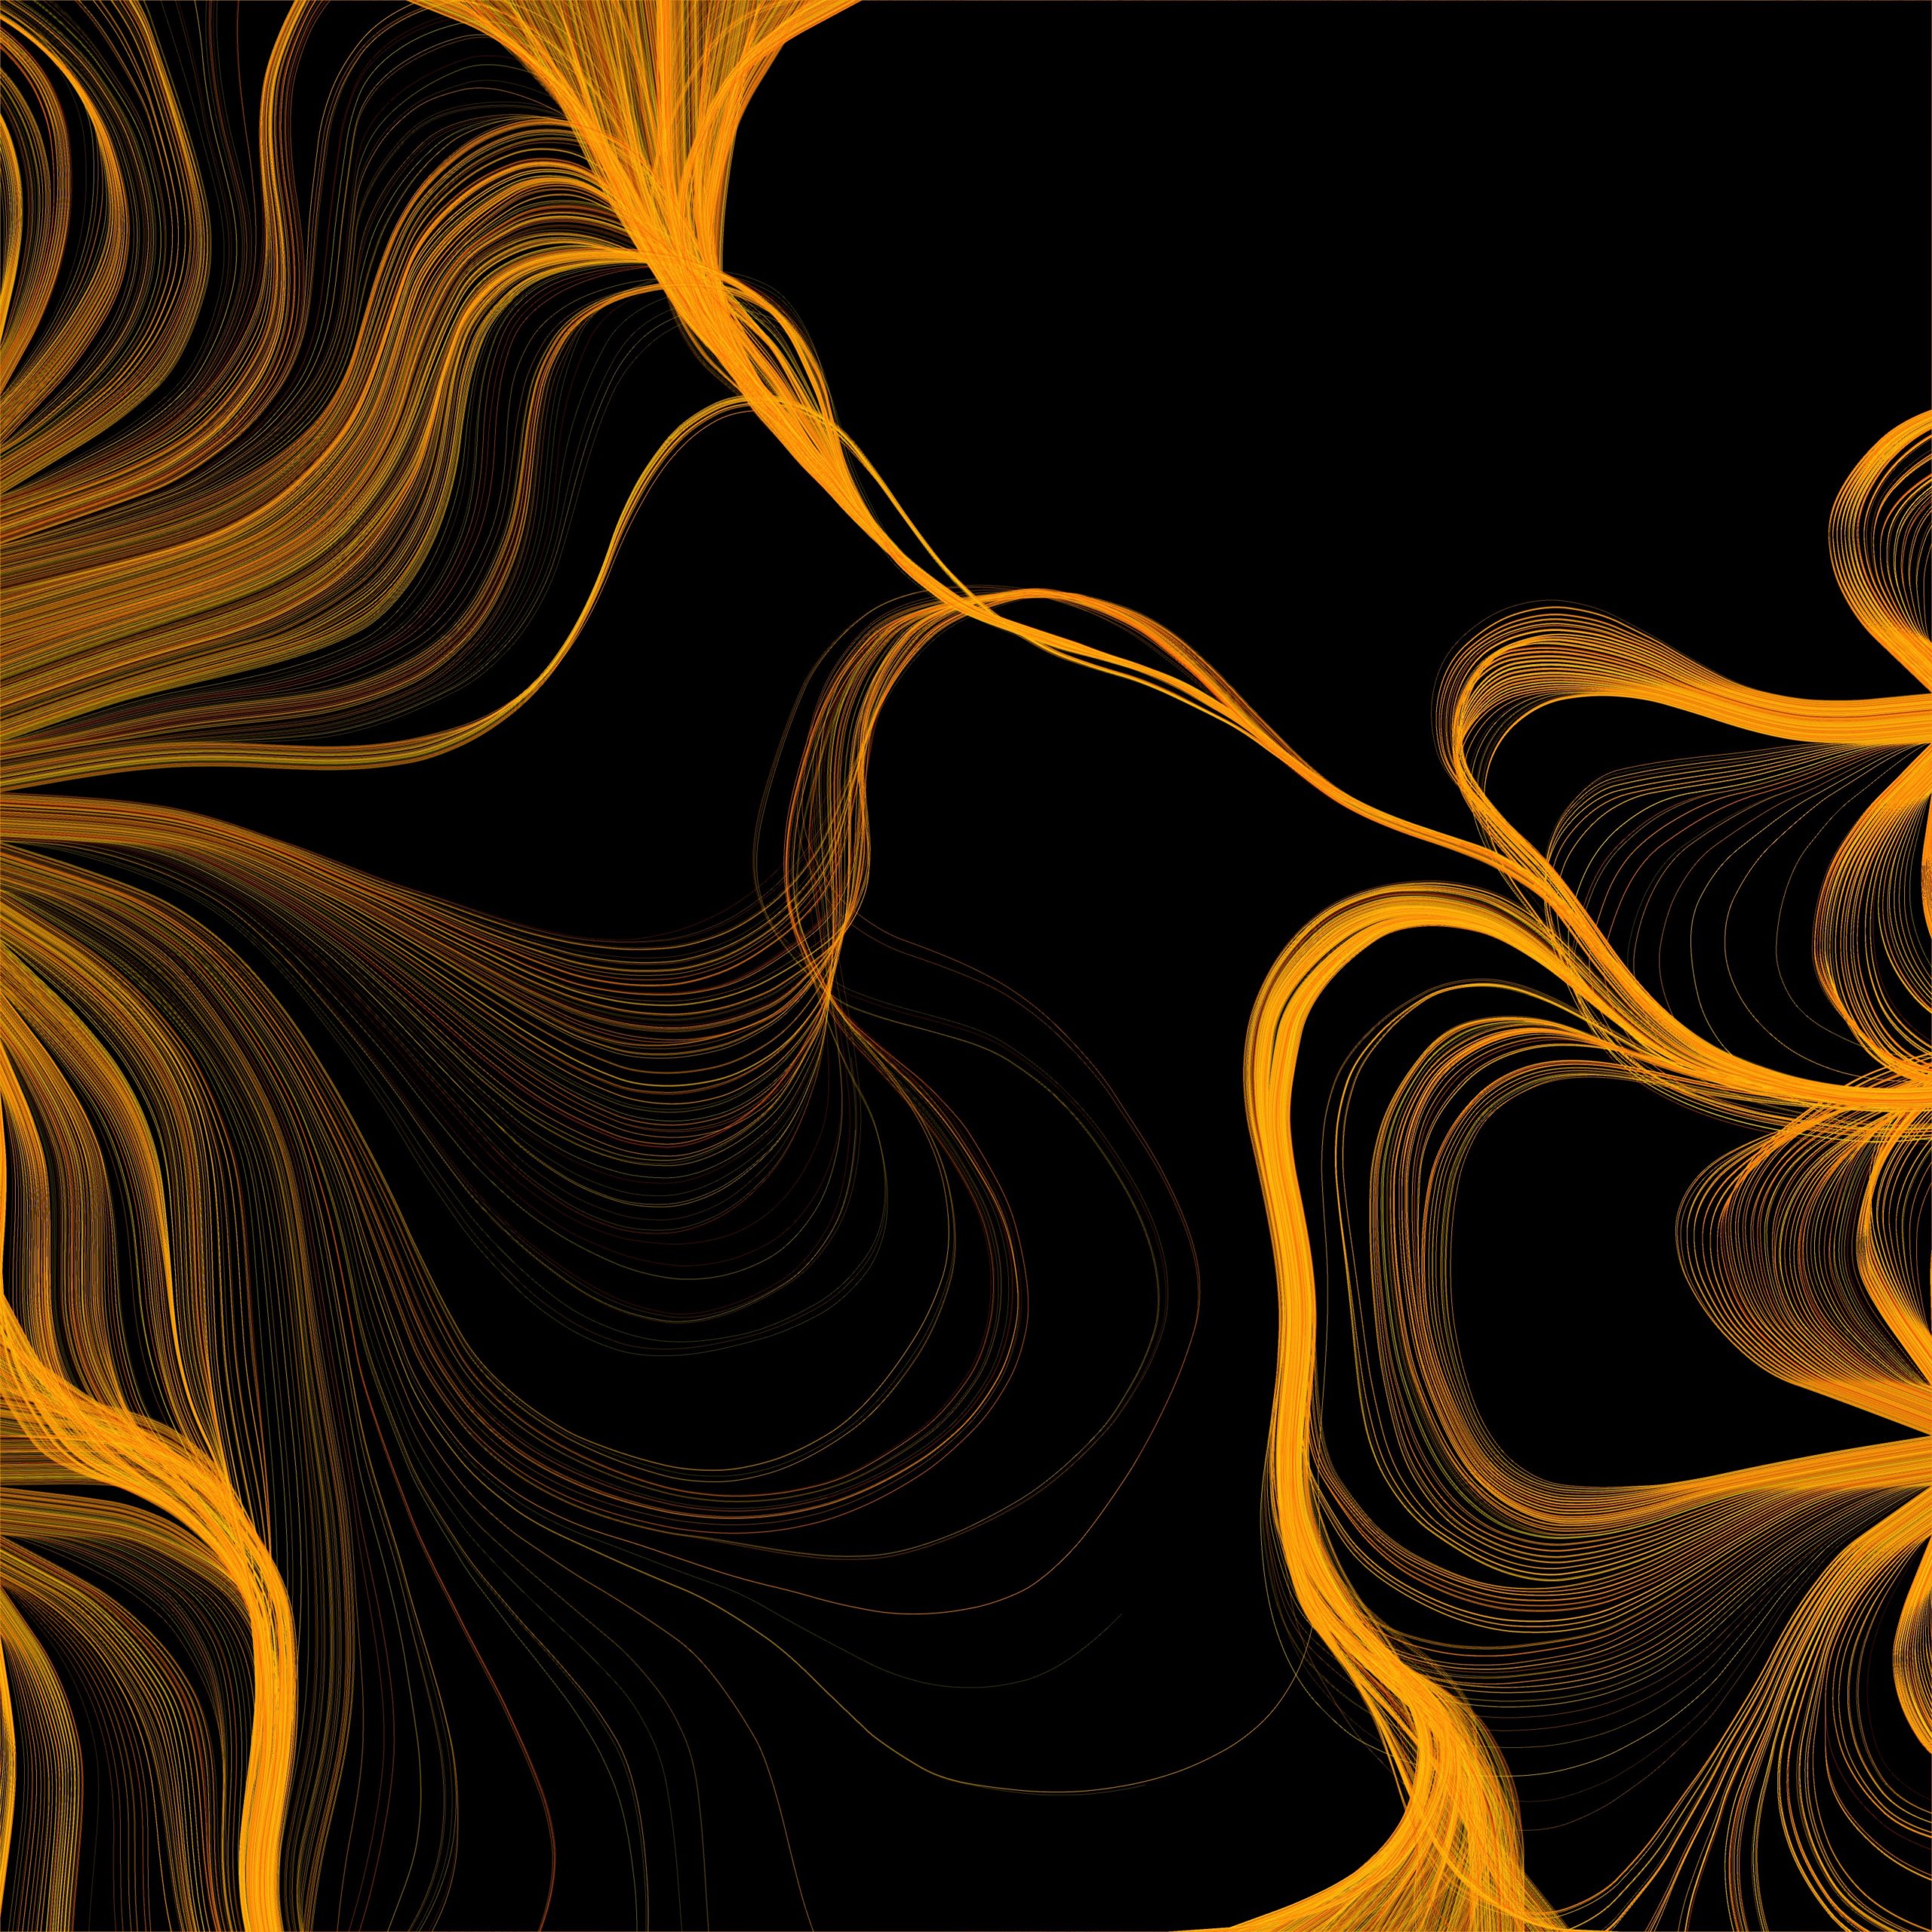
Six compositions selected from 2 different generations.
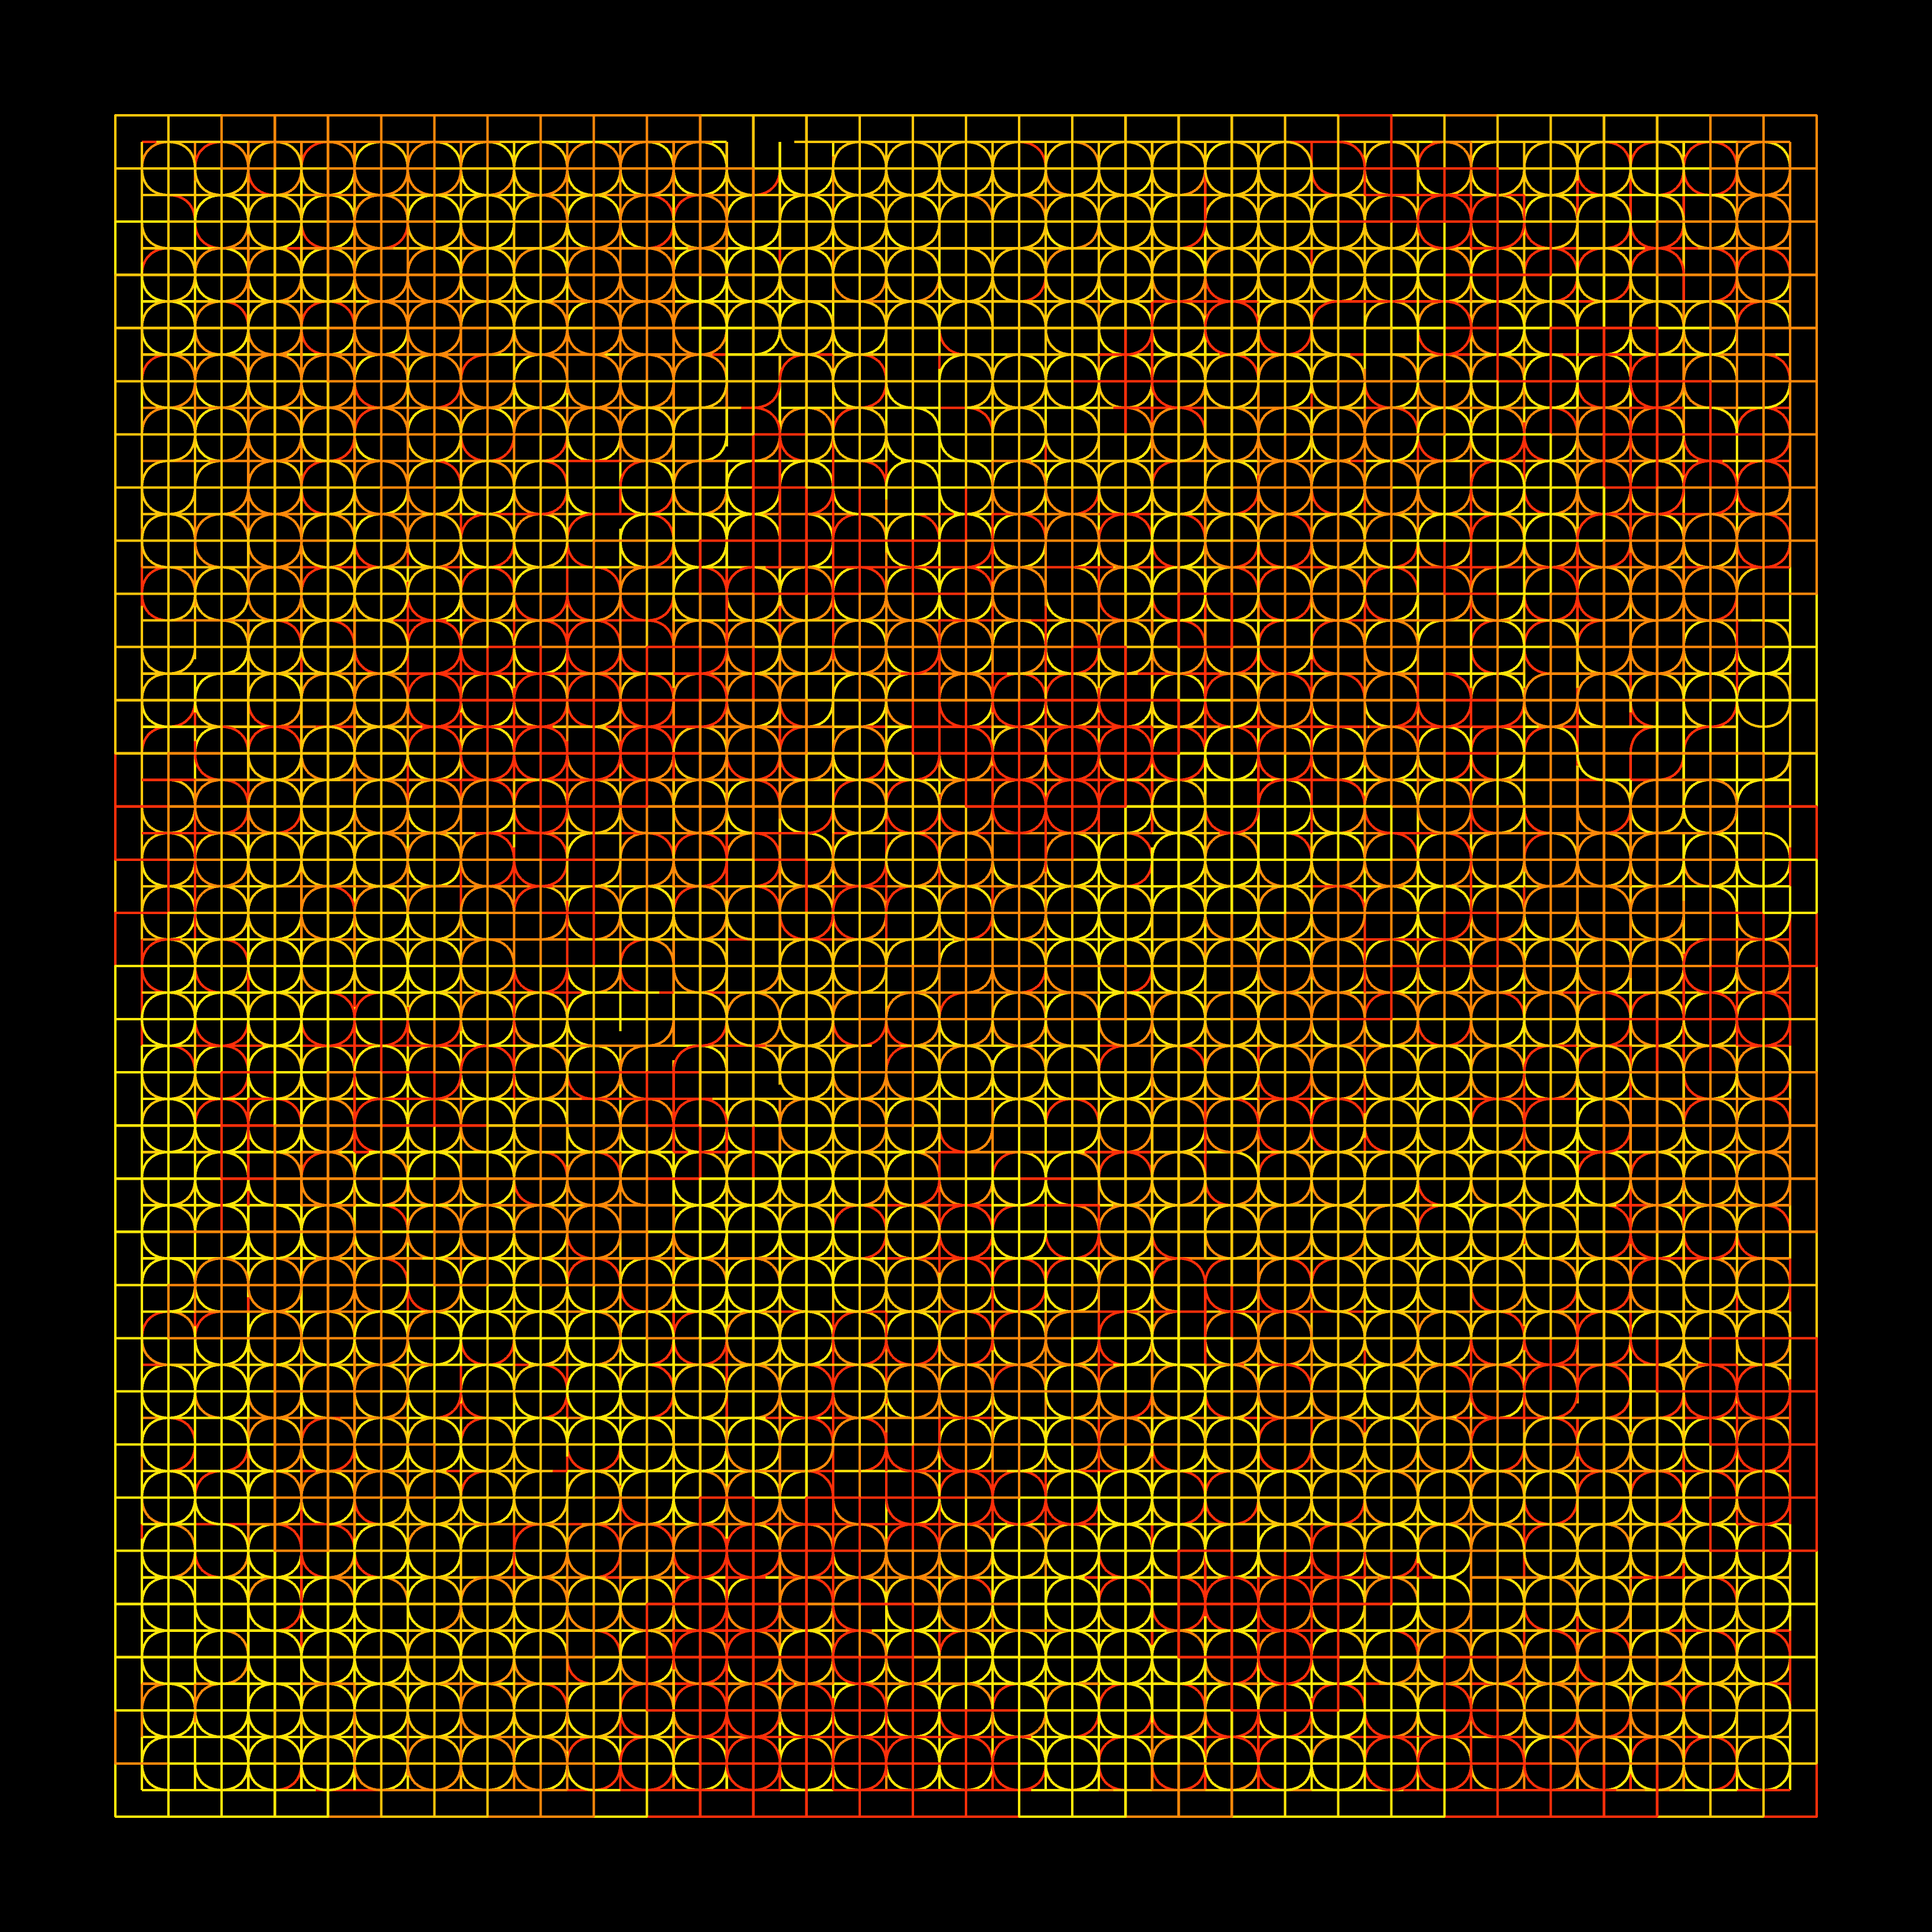
The spirographs above were created by a genetic algorithm. A collection of 36 compositions is generated at random and placed (by me) into three categories: top, mid, and bottom tier. Pulling most often from the top tier, second most from the mid, and least often from the bottom tier, a random sample of compositions (allowing for duplicates) is drawn from the 36. These selections are carried forward to the next generation. Within each new generation, individual compositions trade some of their parameter values (genetic code) with another composition and then some random mutations are inserted. The code-swap provides cross polarization, allowing attributes to be shared among the population. Mutations inject new twists, sometimes favorable, sometimes not so much. The resulting 36 compositions are then viewed and sorted to evolve the next generation.
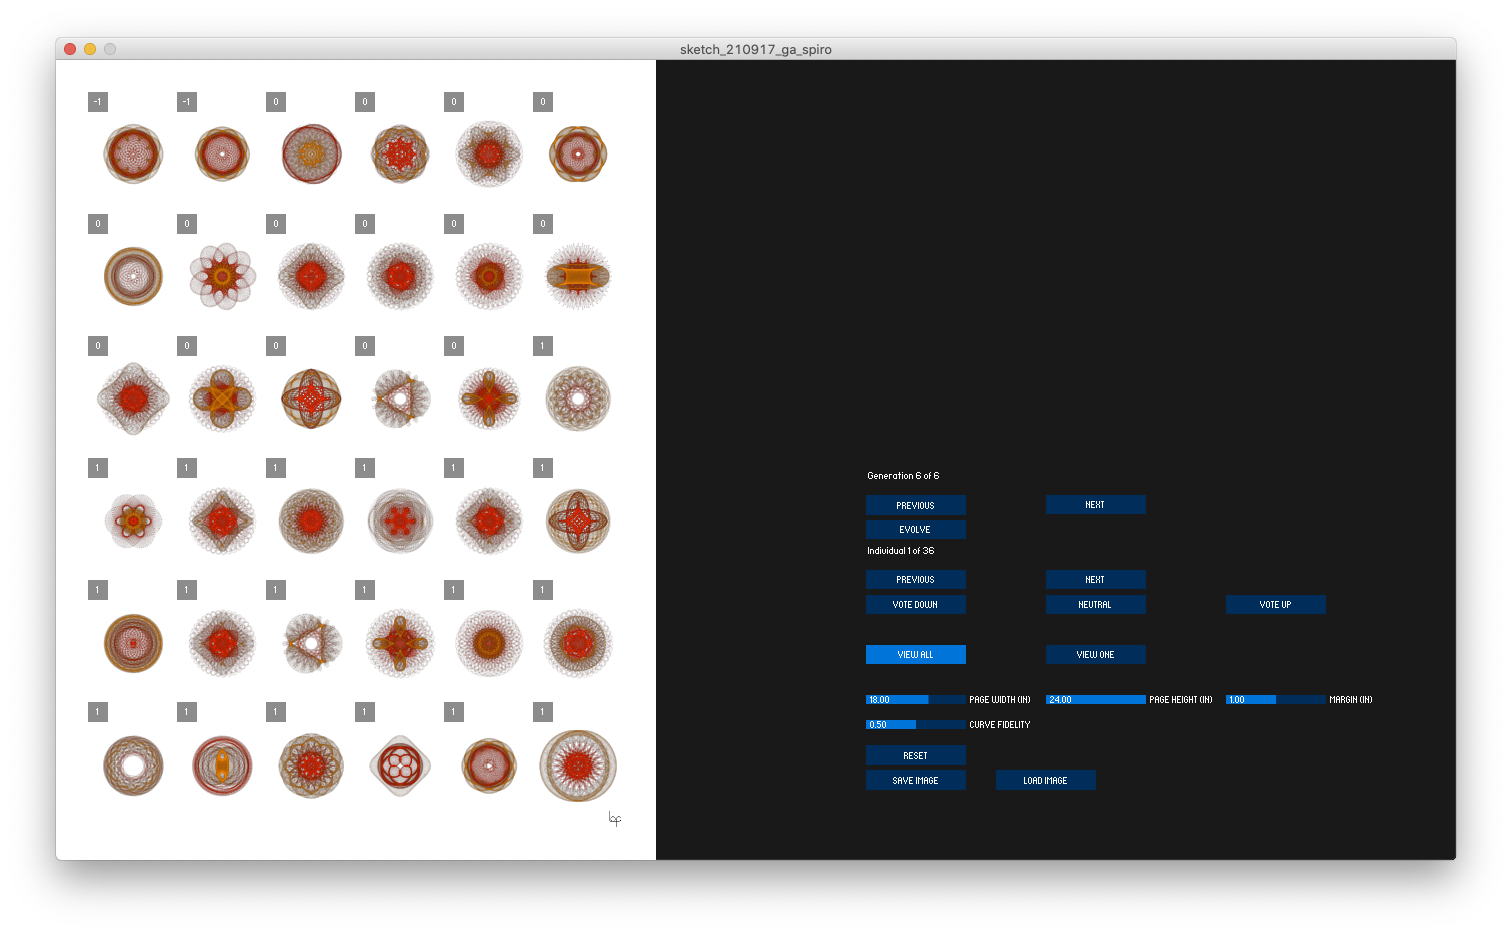
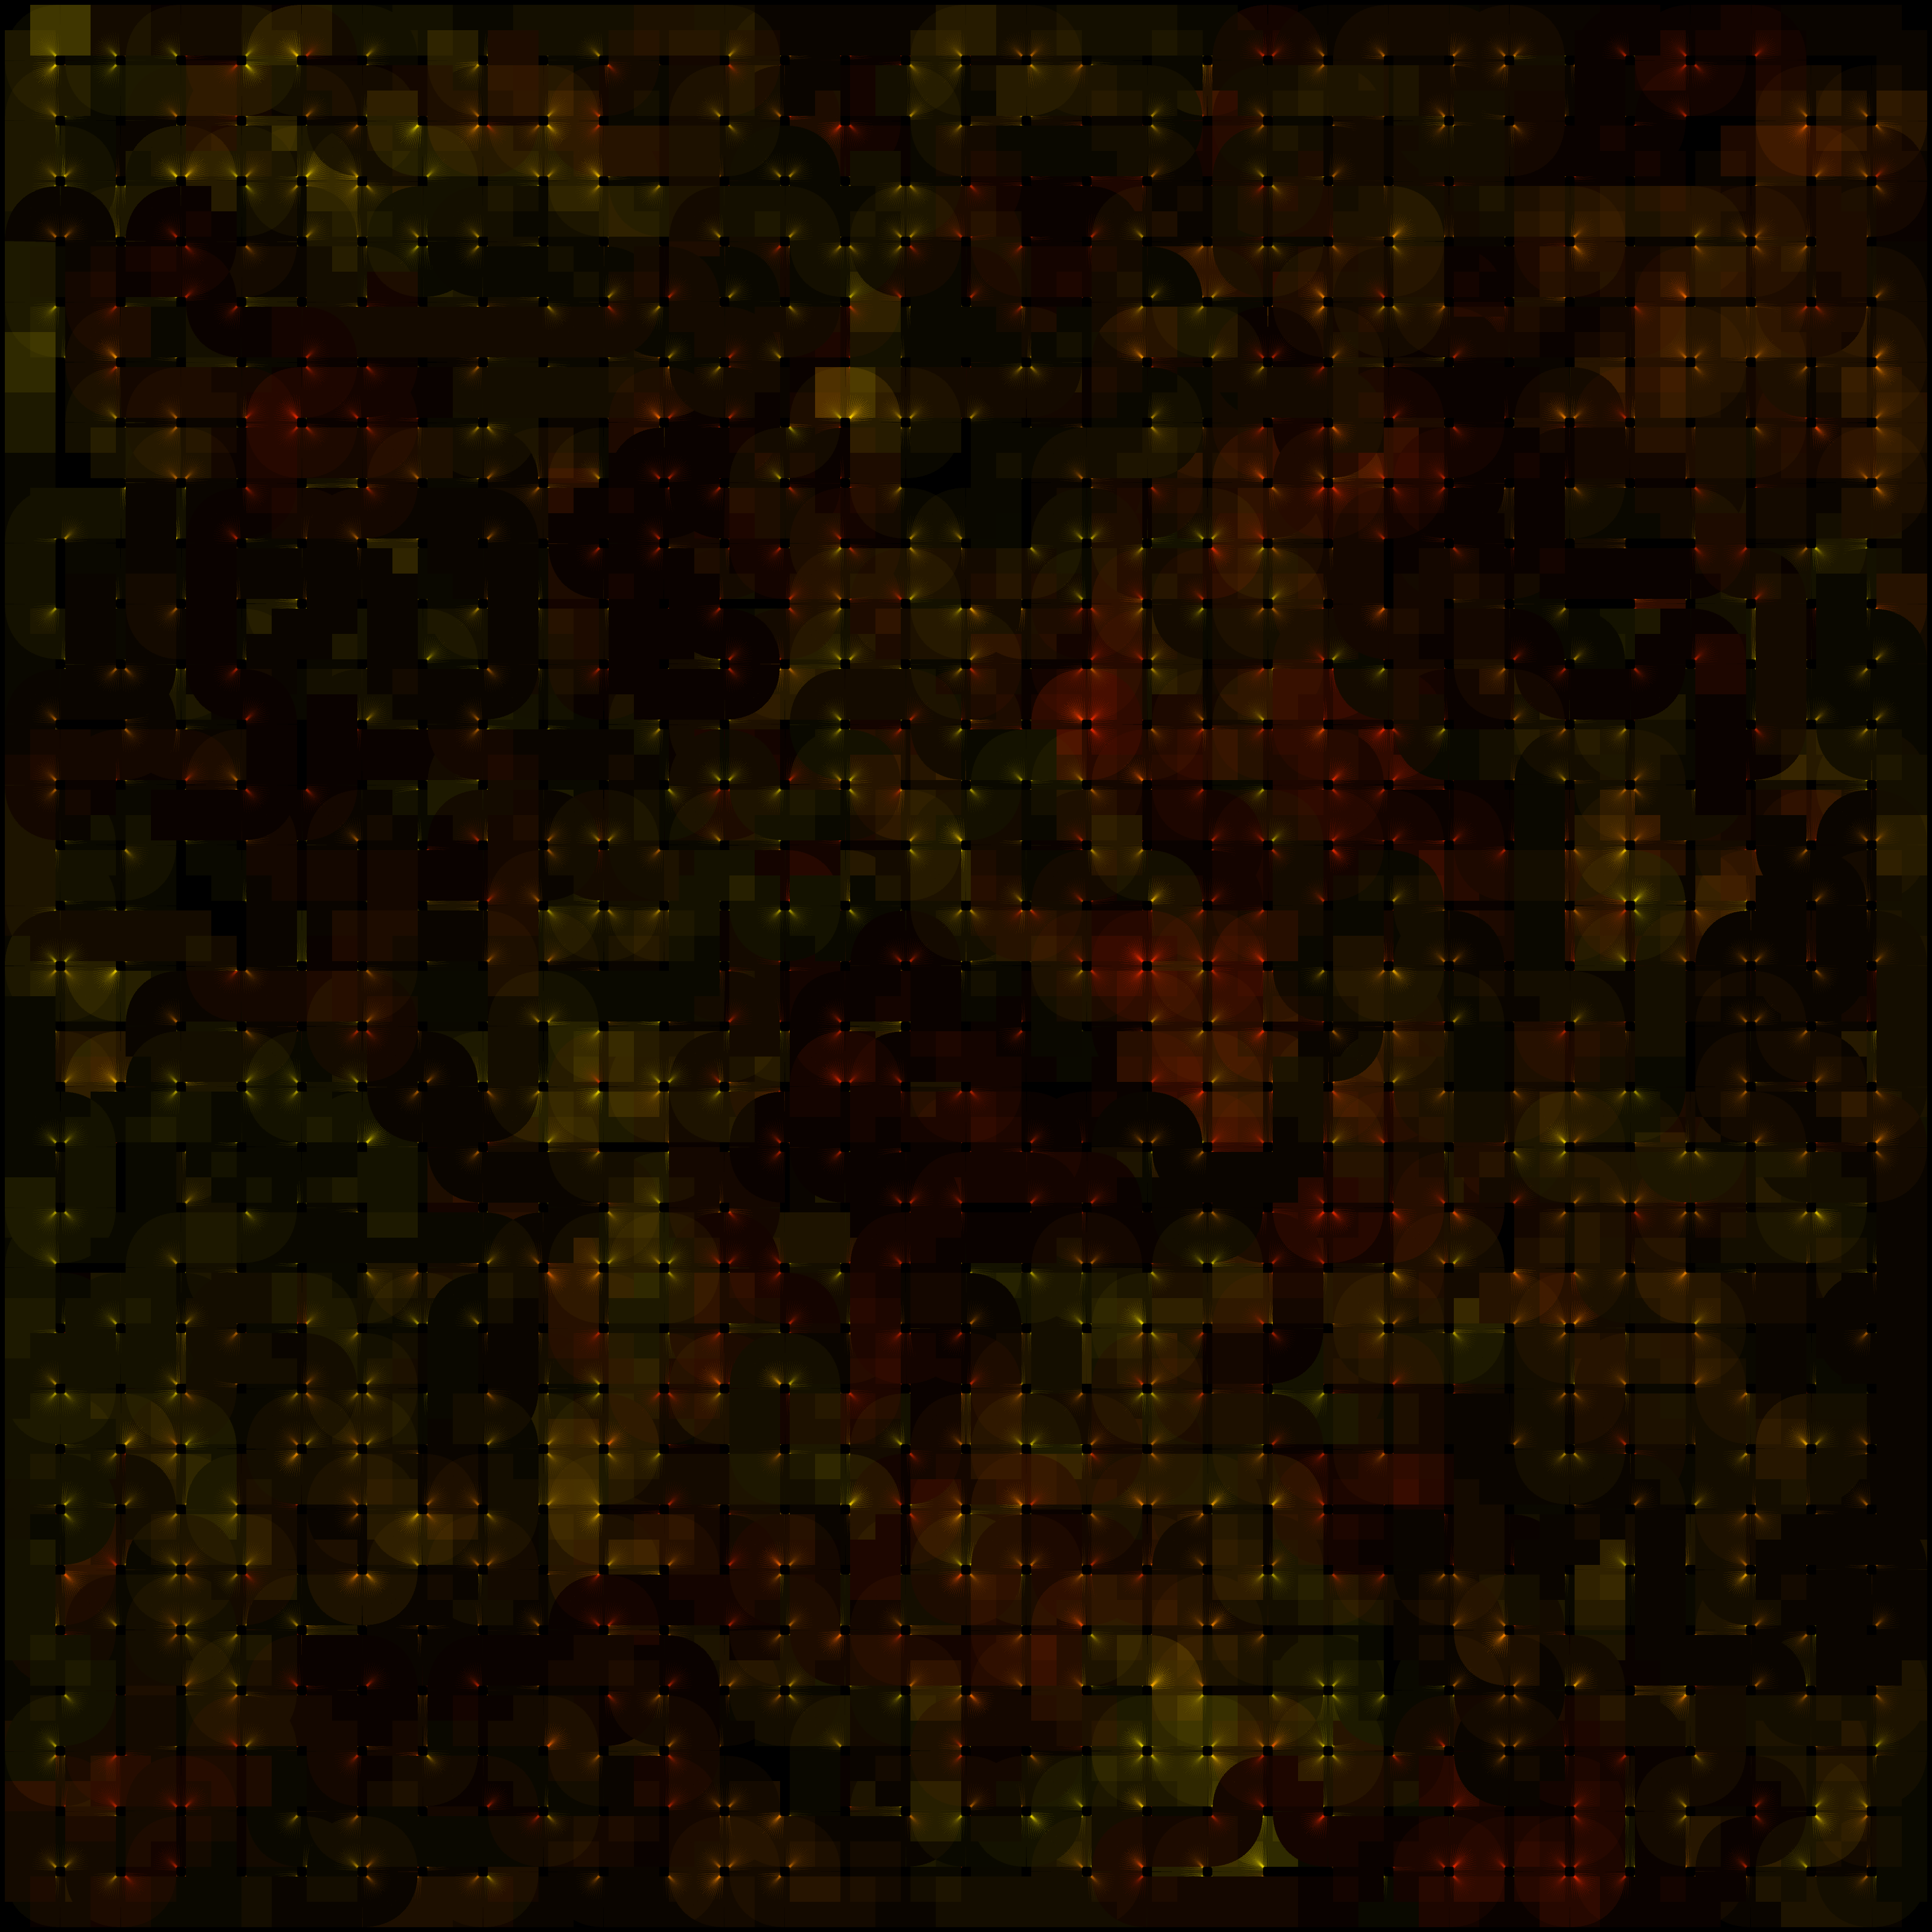
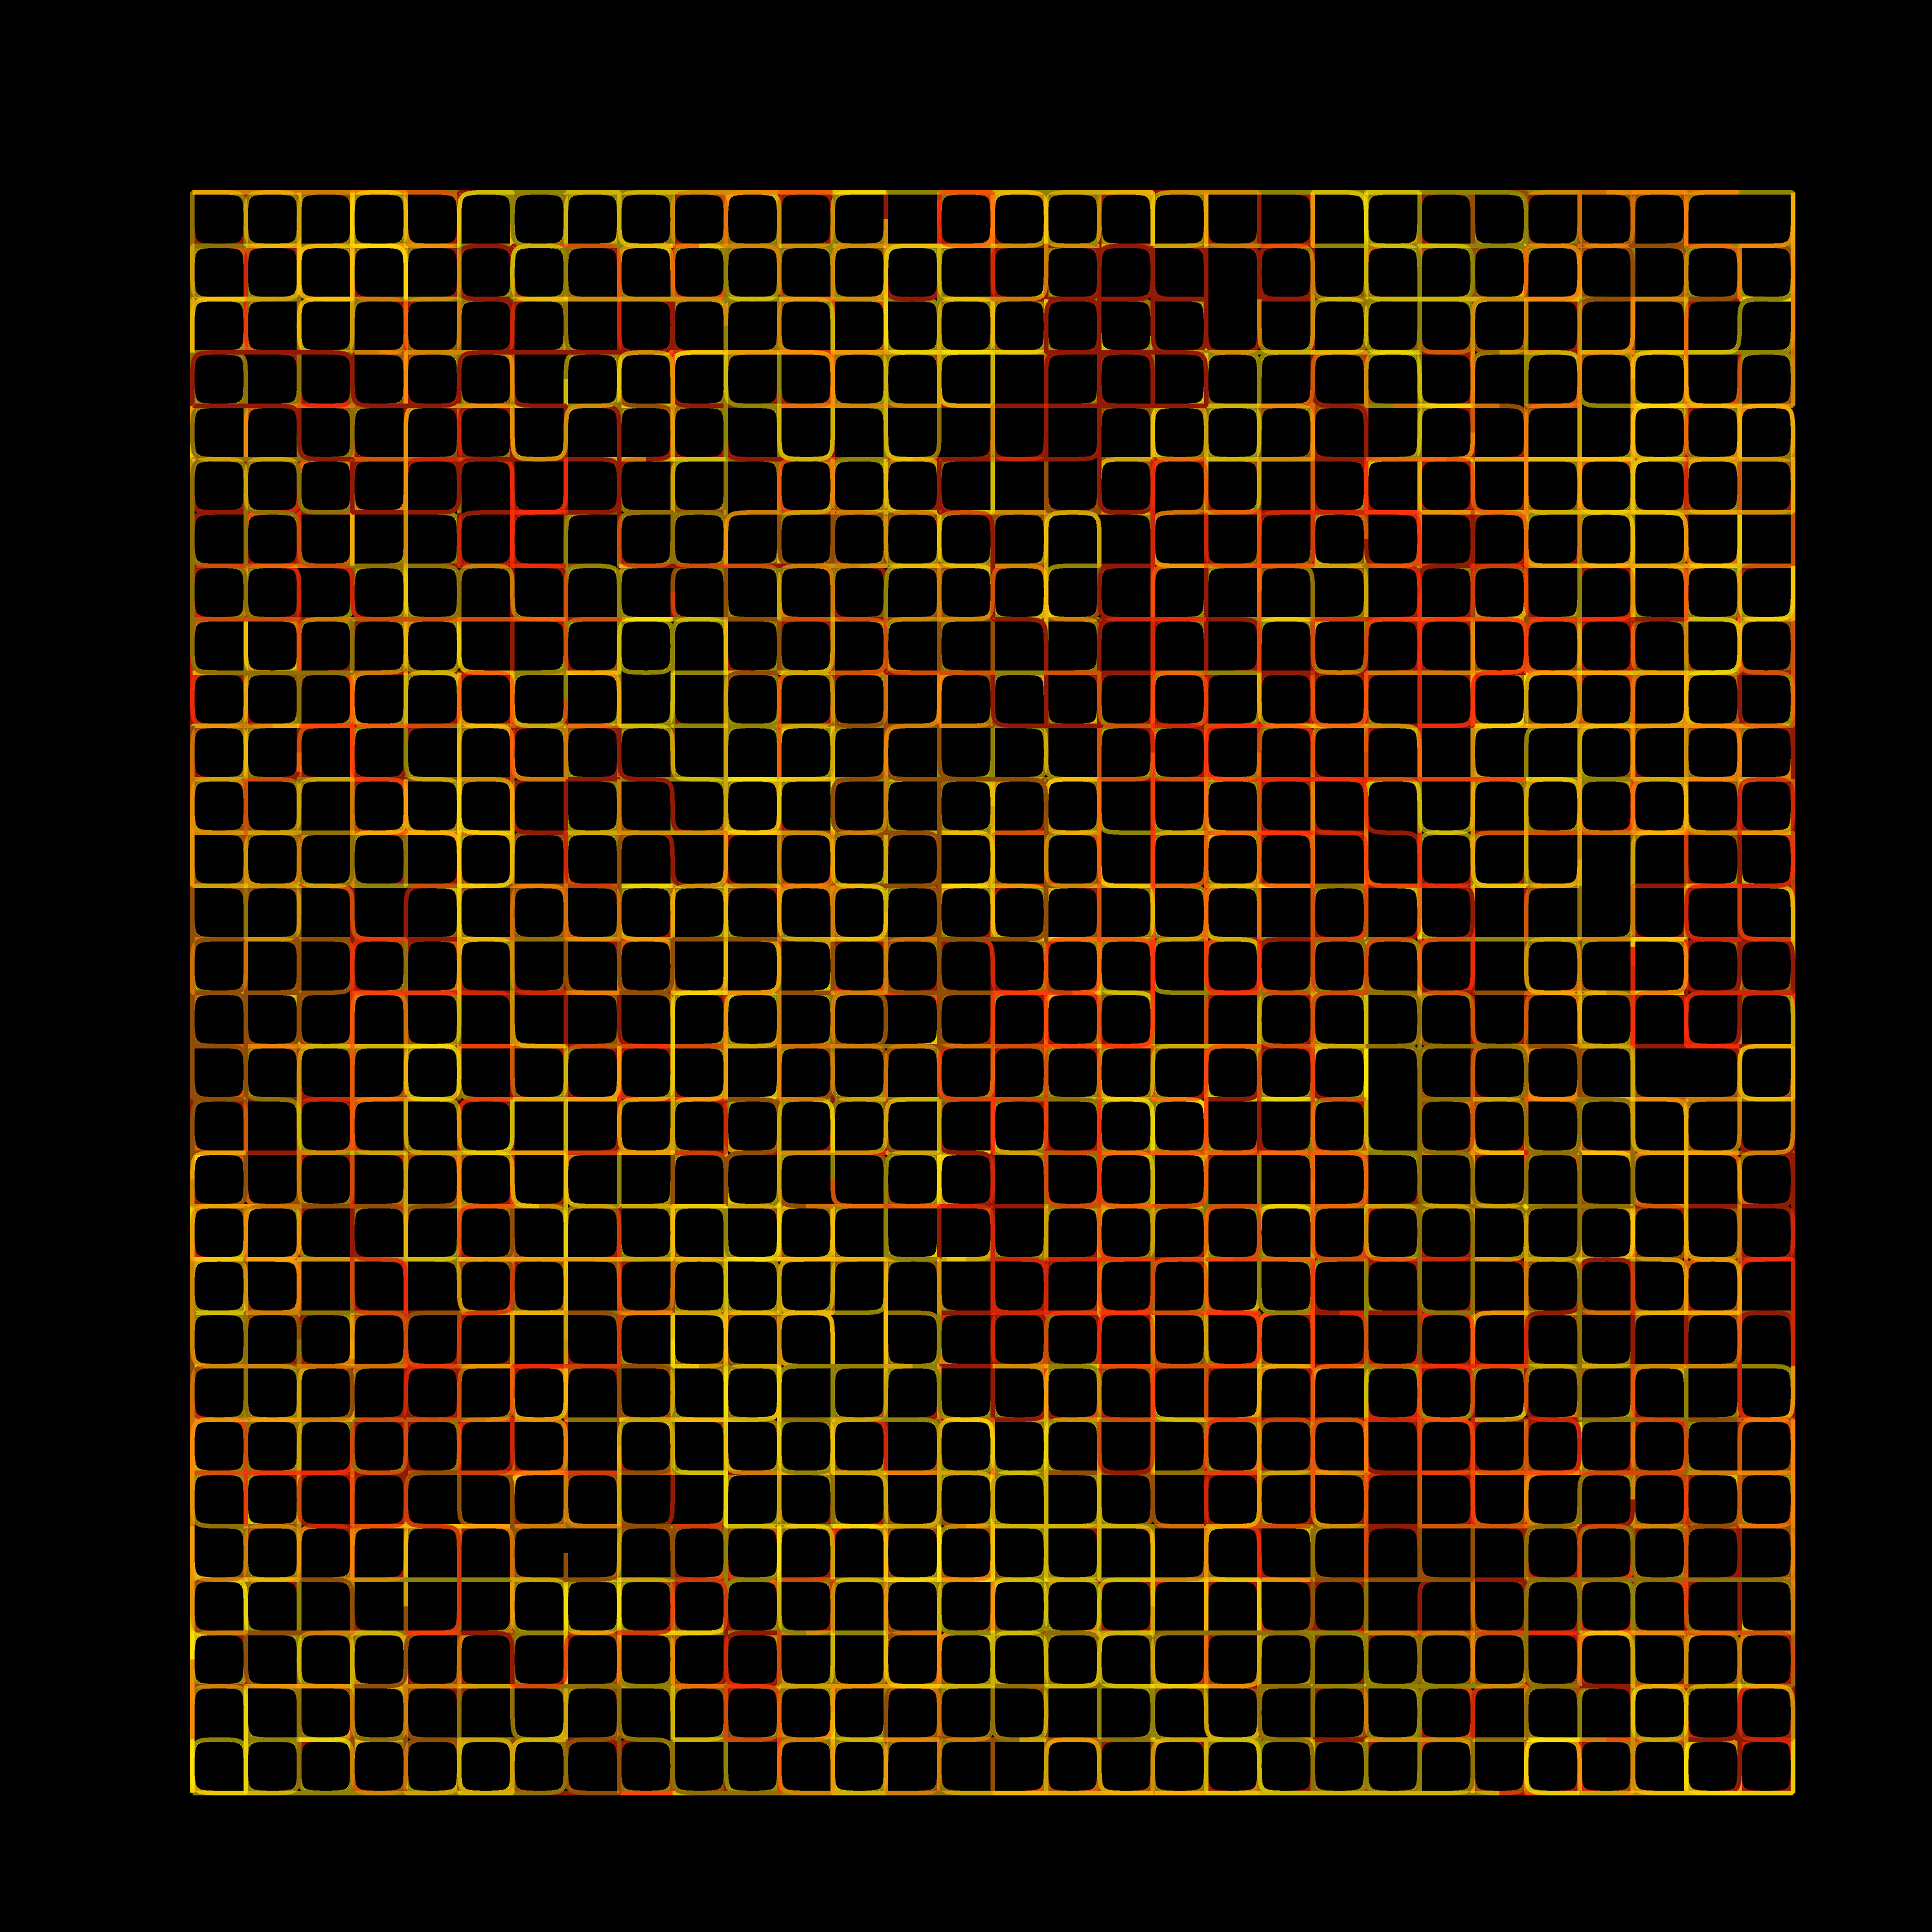
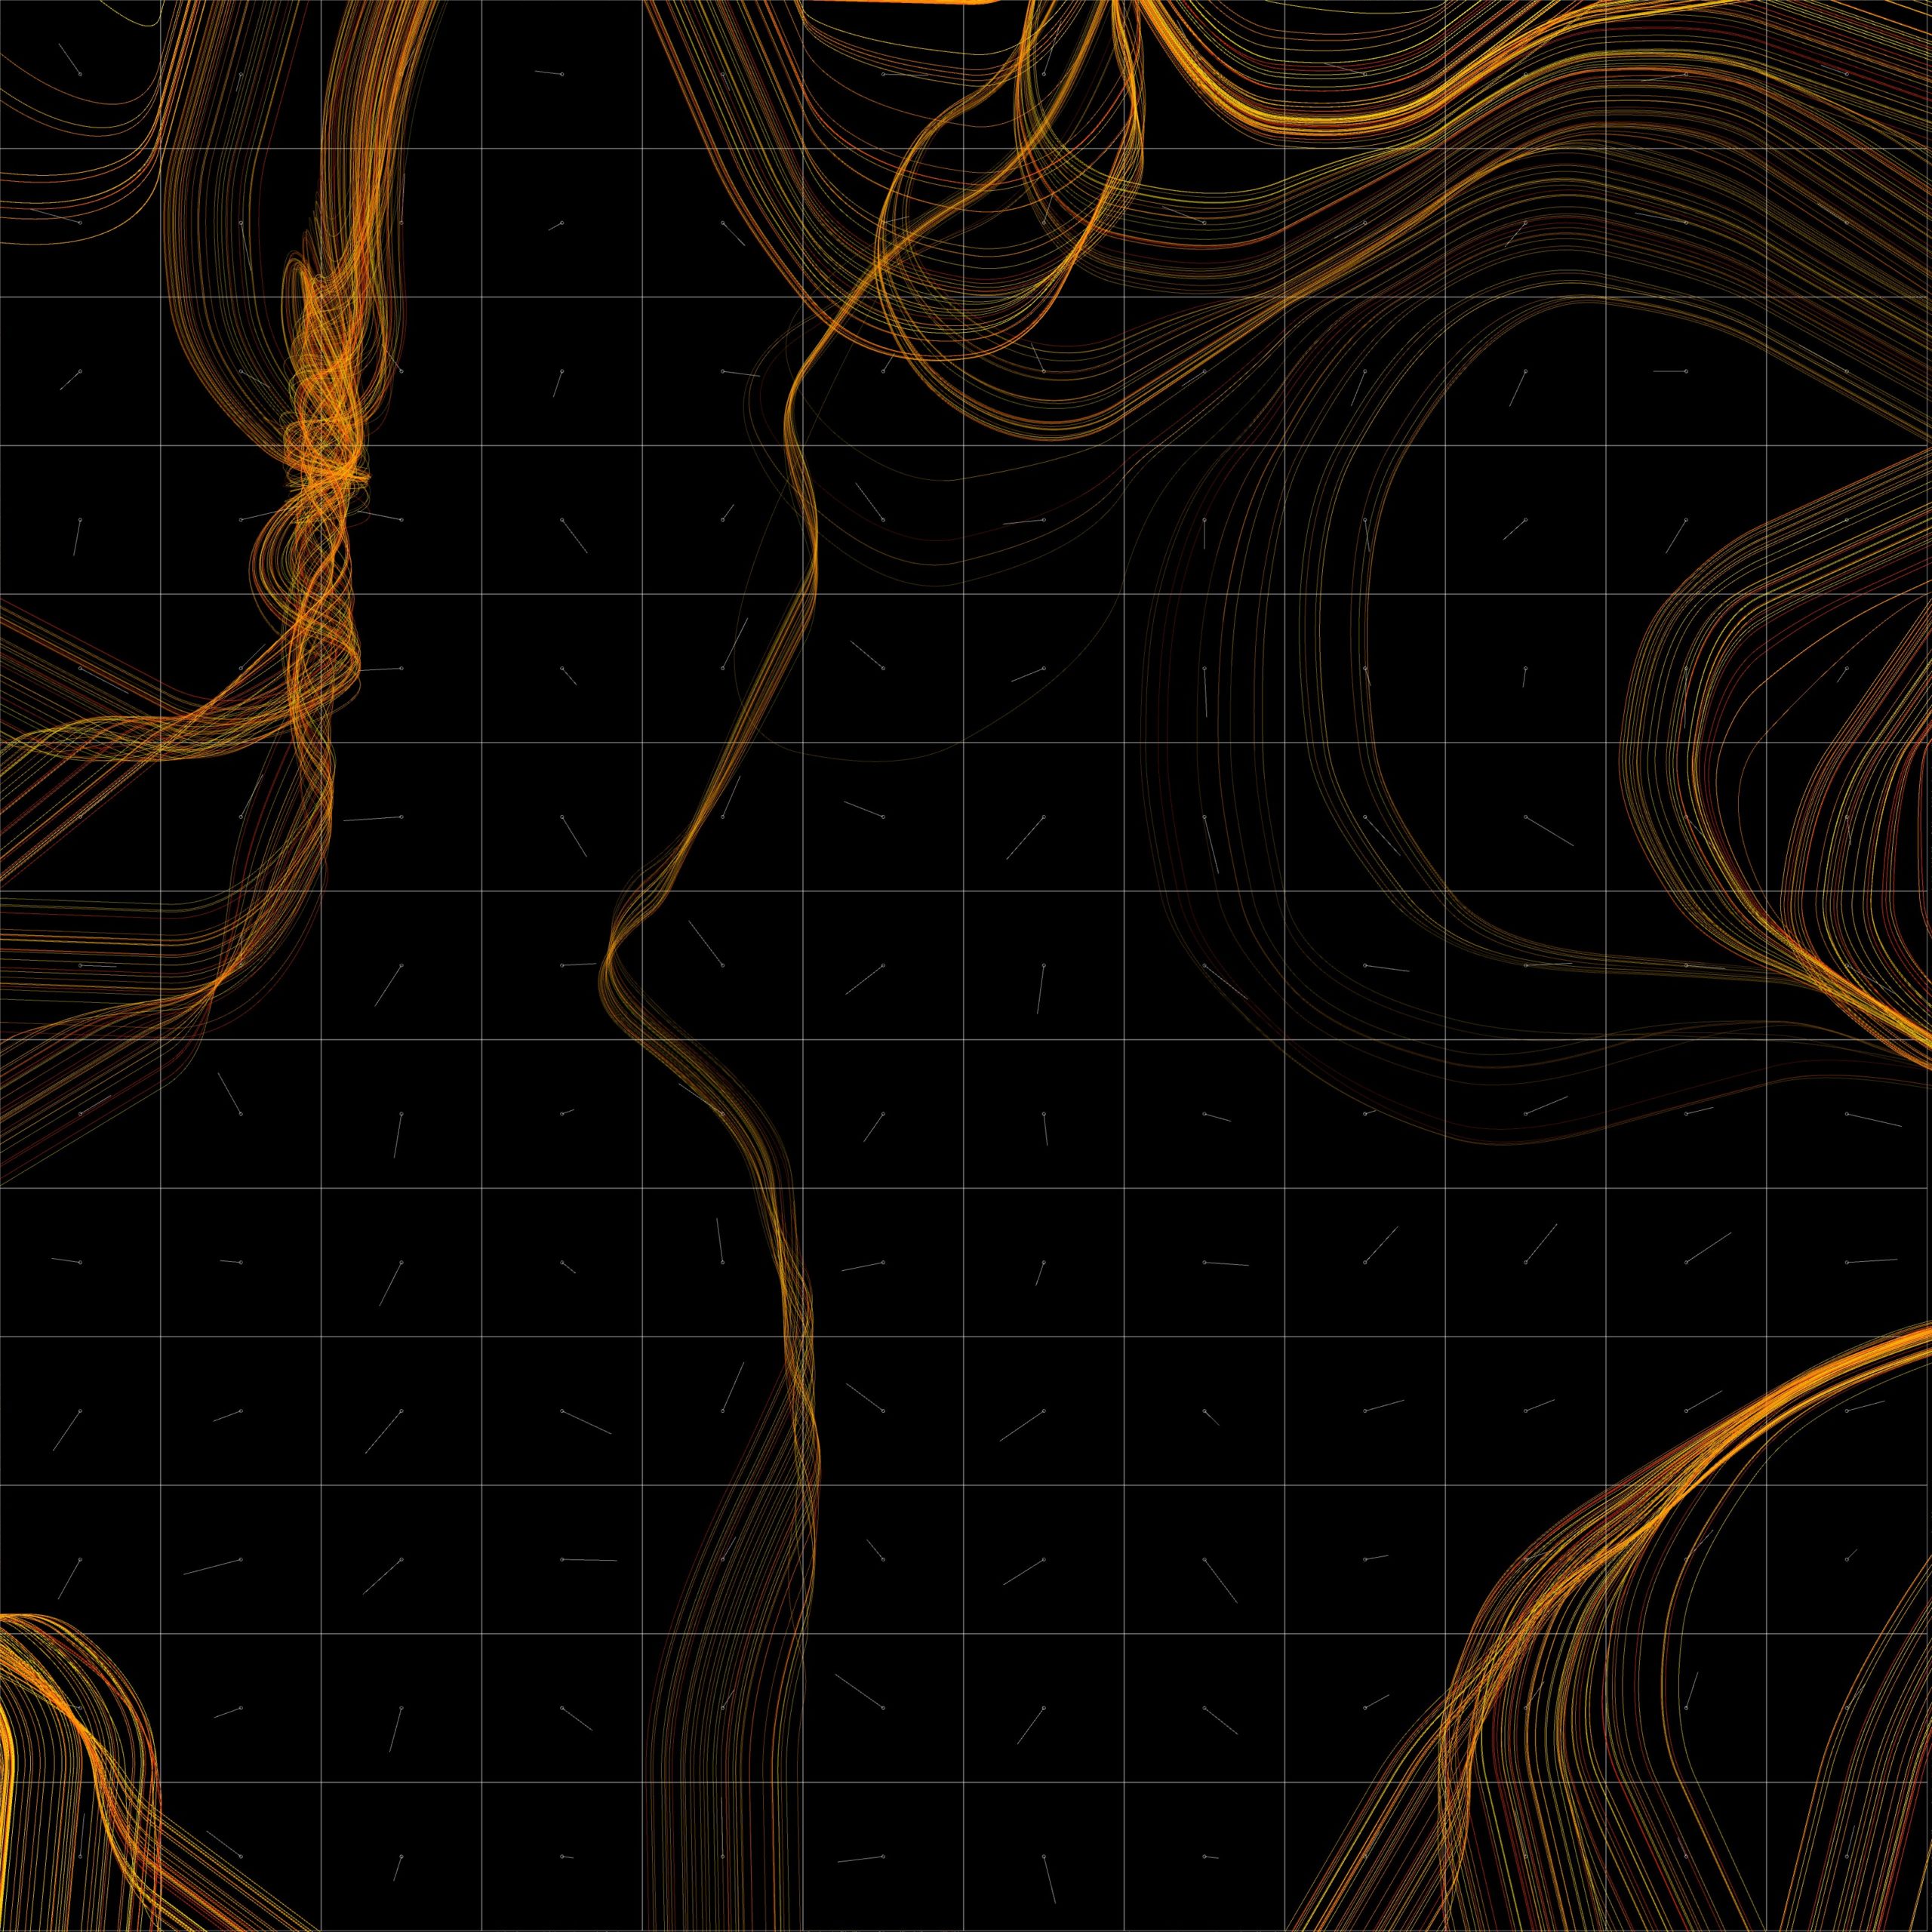
above: the first generation (entirely random). below: the sixth generation.
Typically, in a genetic algorithm, an automated scoring algorithm would determine the fitness of each composition. The human involvement in the process allows the evolution to proceed more editorially.
It is a quick way to visually search through a parameter space. By selectively upvoting compositions of interest, one can create a population with variations on themes of interest. The process is a collaboration between algorithms, tools, and the composer.
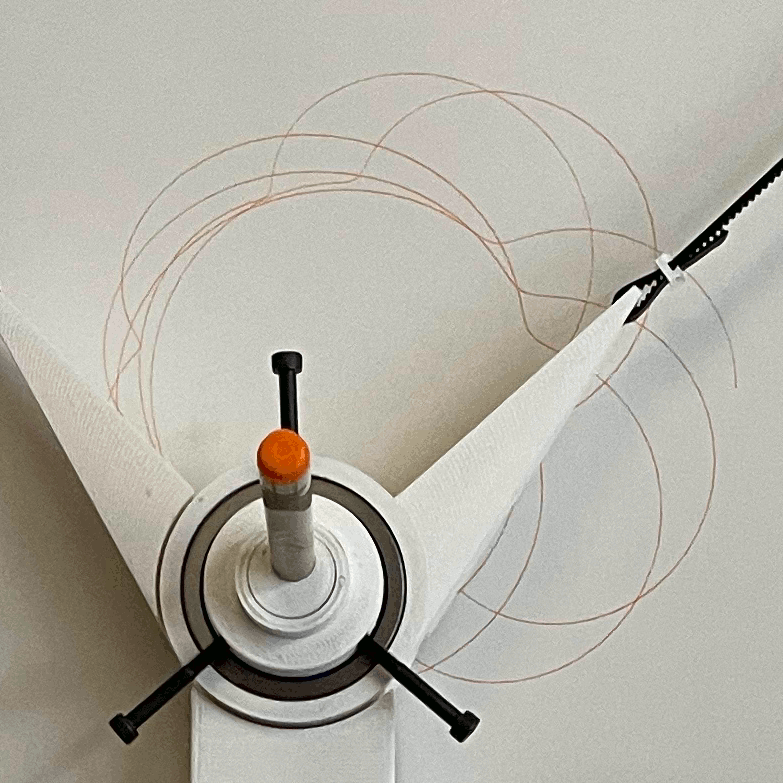
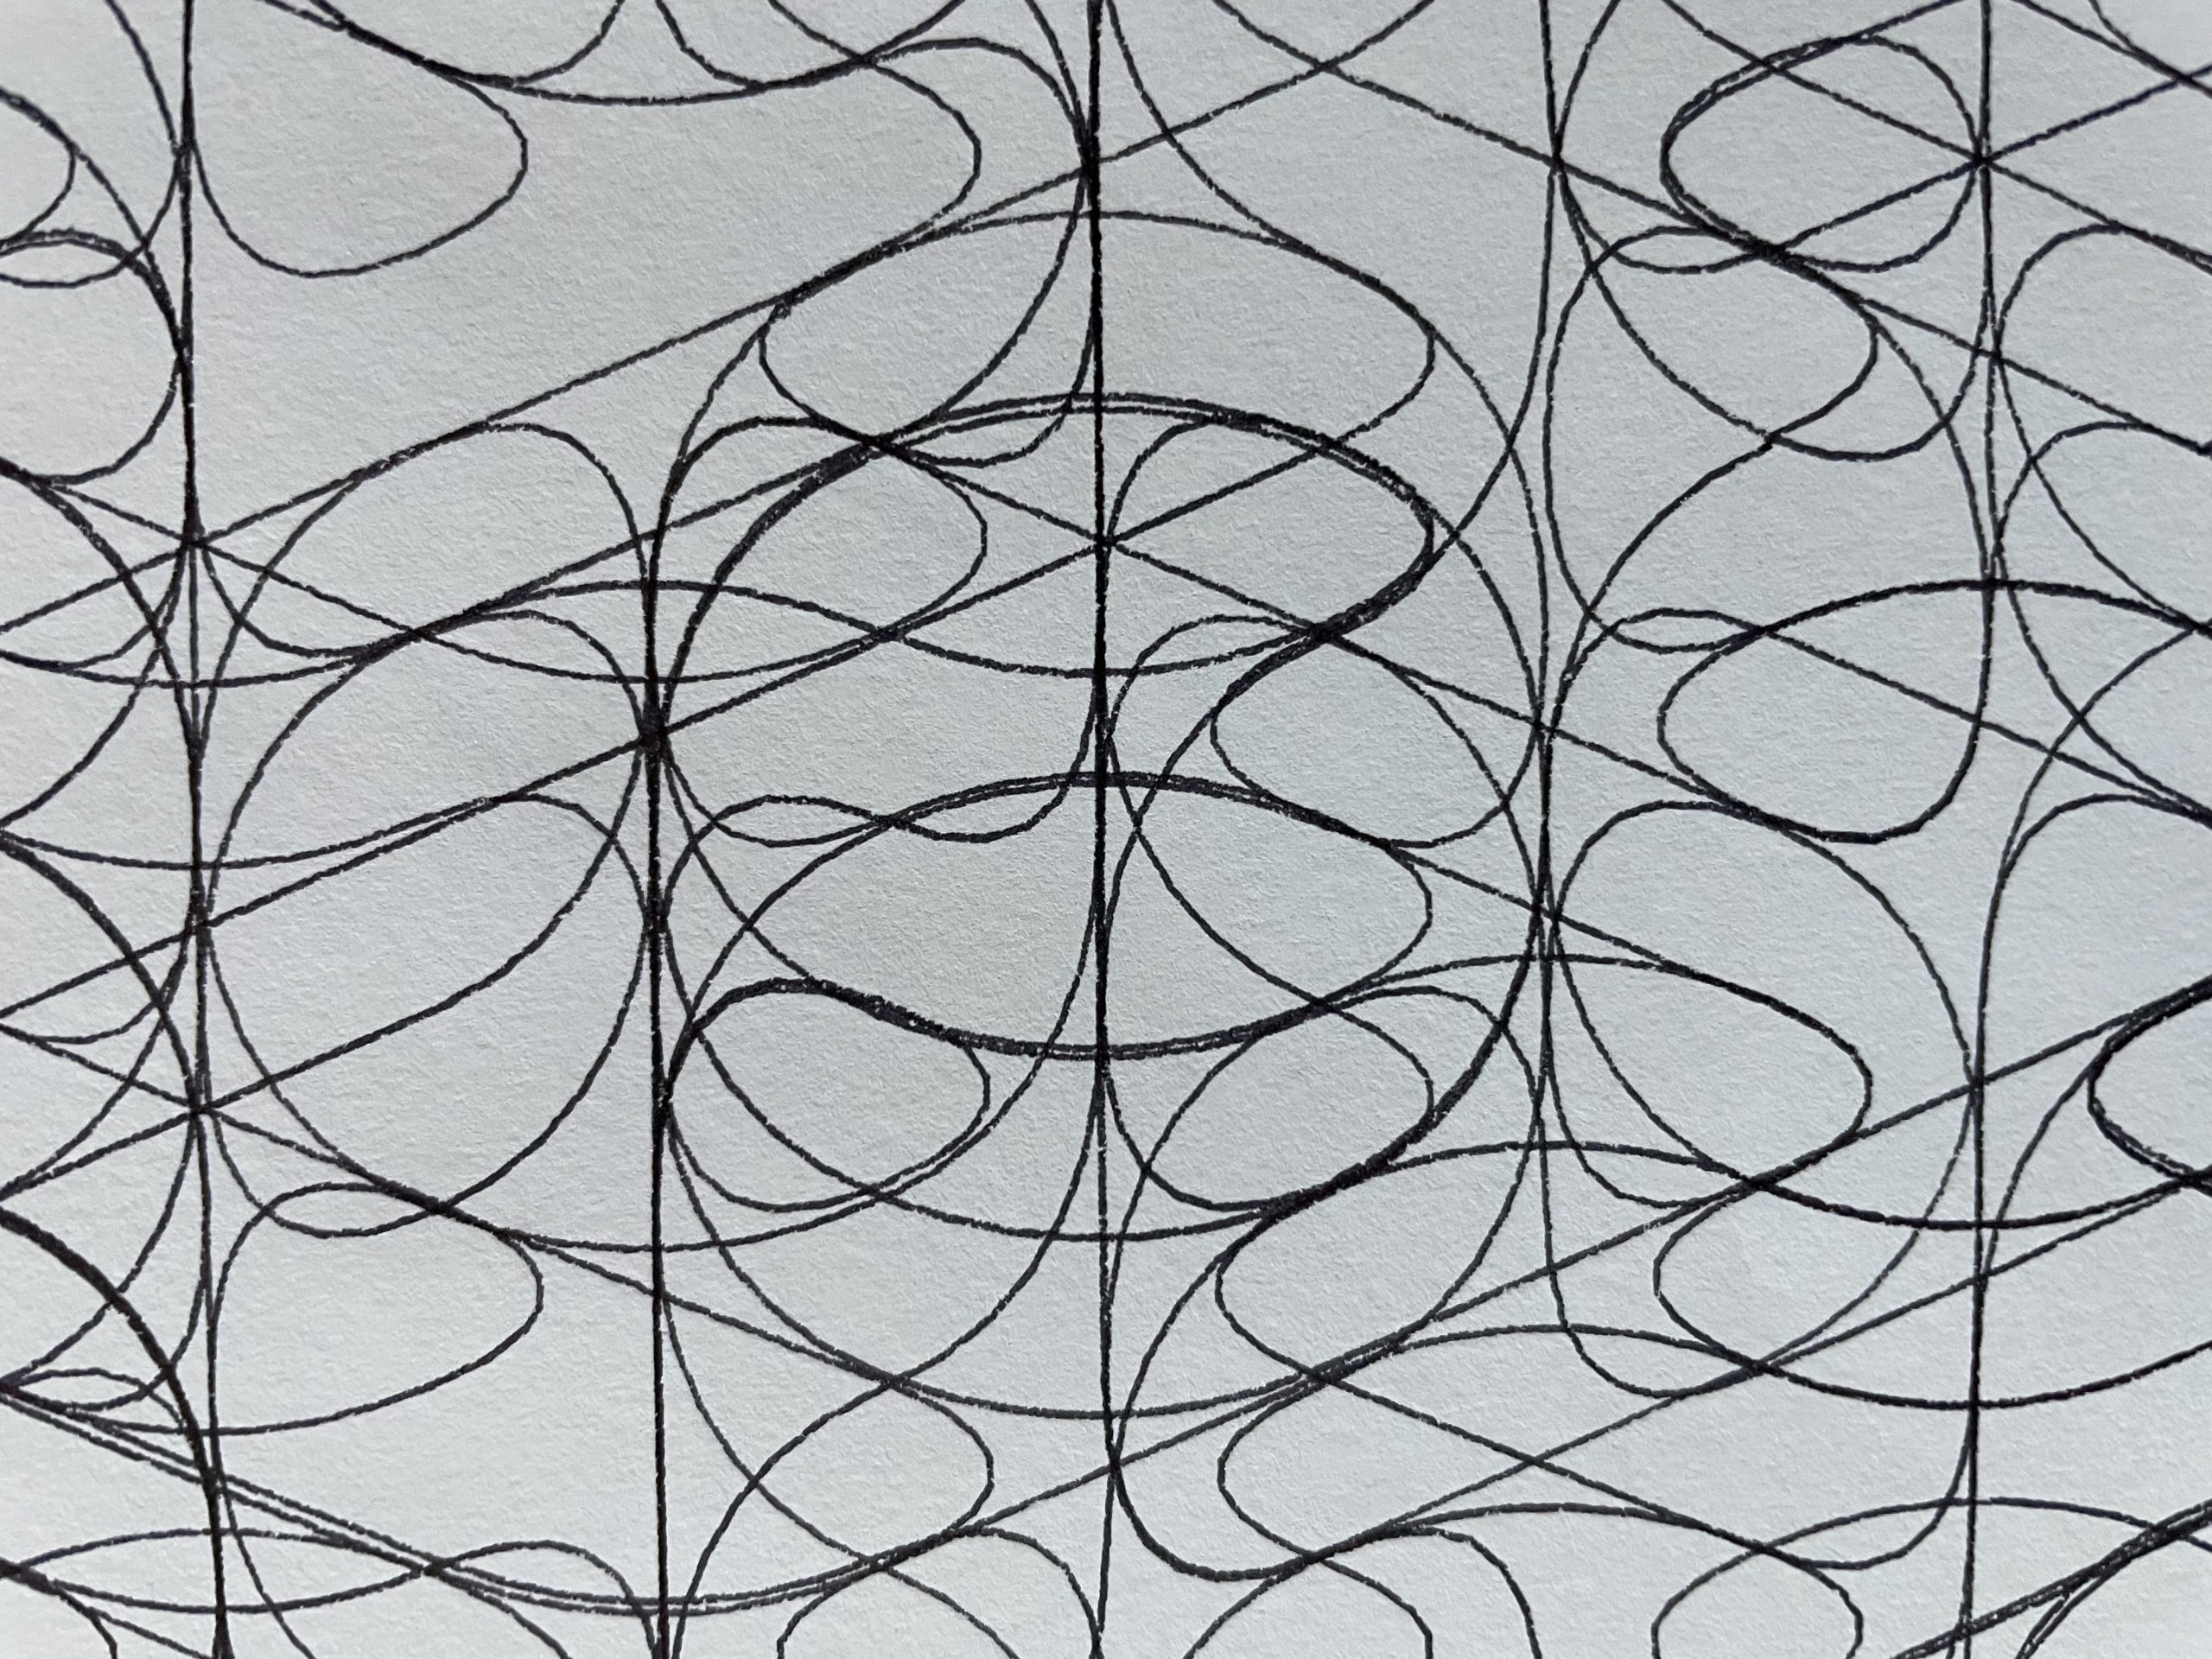
For a while now, I’ve wanted to draw some of my line drawings onto large format paper and I’ve finally built myself a vertical plotter. There are several great tutorials online for building plotters that suspend a drawing gondola from two motors, use polar coordinates to control how the gondola travels, and a servo motor to raise and lower the pen. The video below shows a complete test plot on my plotter.
Design
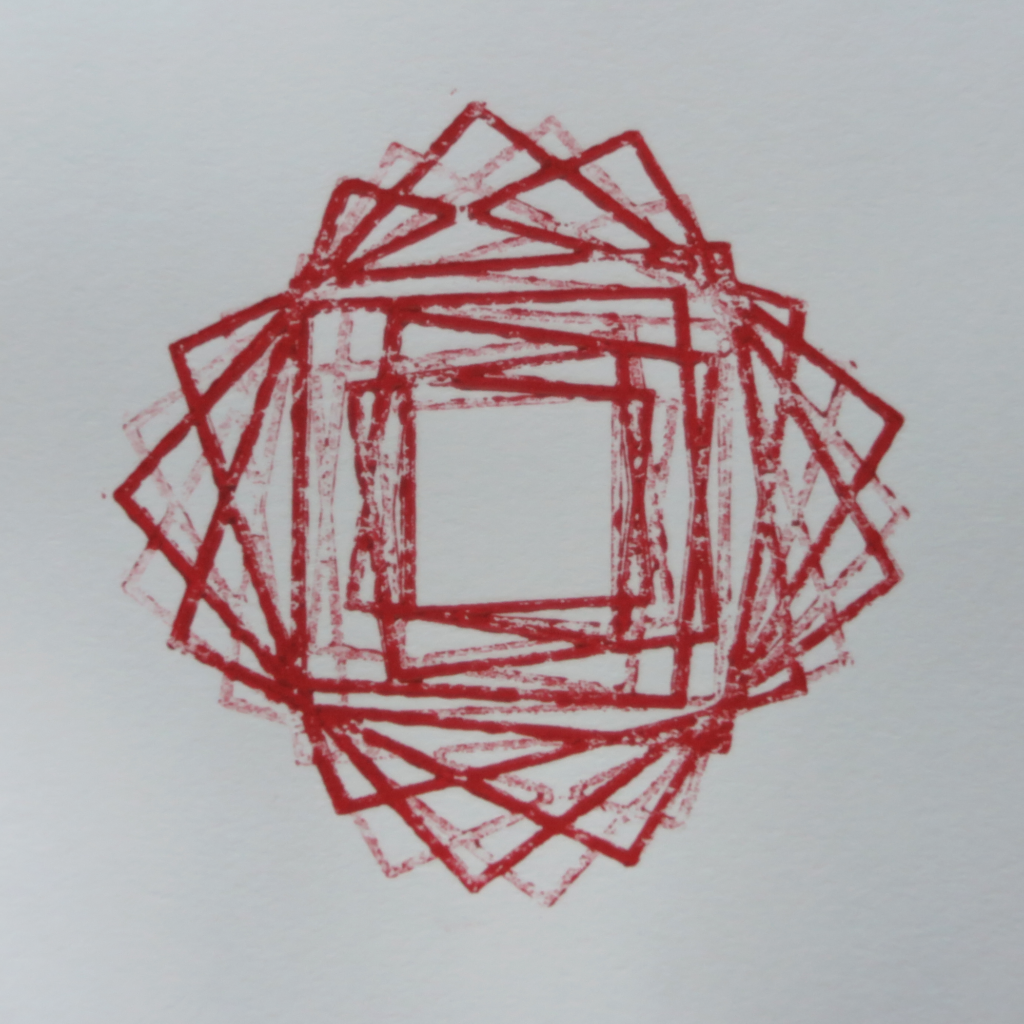
Much of the inspiration for the design of the penelope’s gondola, came from MTvplot. Like MTvplot, I decided to use large bearings with attached arms that rotate around a central point where the pen is placed. Keeping the pen tip in the center like this increases the accuracy of the plot. As the gondola moves left to right, the body of the gondola tends to rotate a bit relative to the the paper (for example, due to cable drag). With the tip at the center of rotation, the tip remains in the same place as the body rotates. Below are images of the first version of my gondola which is missing the weight I added in a later version.
To be able to easily adjust the width of my the plot area, I designed the motor mounts to hang from some picture rails already in my space. Within these mounts, I included smaller bearings to apply pressure to the belt and help hold it in contact with the teeth of the pulleys. I saw a similar detail in one of the online examples, but I can’t find the reference again.
For the counterweights, I settled on using pennies and printed cylinders to hold them. One of the benefits of this approach is that I was able to easily tune the weight by adding and removing pennies. At first, I tried to weigh the gondola only using the bearings (v1 pictured earlier), but I found that they did not provide enough stabilization when the distance between the gondola and motors was greater (for example, the bottom third of my 18×24 inch paper). This resulted in some shaky lines when drawing tight curves near the bottom of the page. To improve stability, I added a cylinder to hold pennies to v2 of gondola.
To help hold the pen with the tip at the center of the bearings and, when possible, at an angle to let ink flow down, I created a general purpose guide. This guide, is useful for quickly testing different pens, but proved difficult to set up accurately. I then created specific inserts to hold pens I plan to use regularly.
For the hardware needed to control the motors, I first started with these two tutorials: https://www.instructables.com/Vertical-Plotter/ and https://www.youtube.com/watch?v=T0jwdrgVBBc. I liked the simplicity of using the motor shield and Arduino Uno — plus I already had that hardware. In the end, I got it working, but the pen traveled too slow to be useful. A friend recommended PenPlotter which uses a board specifically designed for controlling 3d printers. With this hardware, the PenPlotter software and the Repetier firmware included in the PenPlotter repo, I was able to get penelope drawing well.
73 pennies in each counterweight, 25 pennies for the gondola.
The PenPlotter software requires some plotter-specific settings. For my current installation, they are:
machine.motors.mmPerRev = 40. Calculated by multiplying the pitch of the belt (2mm) by the number of teeth in my pulleys (20).
machine.motors.stepsPerRev = 3200. Calculated by multiplying the steps per revolution of my motor (200) by the number of microsteps used by the controller hardware (16).
machine.width = 890. Distance in mm between center of motor axles.
machine.height = 1120. I think this is somewhat arbitrary, I chose the vertical distance in mm from the motor axles to the bottom of the protective board hung on my wall.
machine.homepoint.y = 240. The vertical distance in mm between the center of motor axles and the pen’s “home.” I made the home the center of the top of my drawing page. For convenience, I found that the gondola should be able to remain in this position with the motors off.
Drawings
PenPlotter includes several options for rendering images as a line drawing, but I am using it to draw SVG files. I am using Processing to programmatically create the SVG files. With Processing, there are some default ways to export SVG. The first is to record all shapes that are draw to the screen. The second option is to create an SVG PGraphics object and draw into it. Both of these options work well for 2d shapes, but ignore 3d shapes. The third option is to use beginRaw and capture everything drawn to the screen, including 3d shapes. Unfortunately, this process breaks the 3d shapes into very short lines, each its own line object in the final SVG file. PenPlotter generates a pen down and up for each of these lines in the drawing, resulting in long plot time and ink bleed at the start and end of each line.
So far, I have found the best option is creating an SVG PGraphics object and manually converting 3d shapes to 2d shapes using the screenX and screenY functions. This gives me me the best control over when the pen lowered and raised. It also gives me the ability to more easily crop shapes fit within the page boarder.
In the past, I have used PGraphics to generate high resolution PNG files offscreen and then preview them onscreen at a lower resolution. For penelope, I expanded this approach, adding a second PGraphics object to draw 3d shapes into in order to extract screenX and screenY values to use to draw 2d shapes into a separate PGraphics object. I can then preview this drawing onscreen and adjust the composition to my liking. Once I have a version that I want to plot, an SVG PGraphics object is created to draw the same 2d shape data to export the drawing to an SVG file for PenPlotter.
I use Processing’s beginShape, vertex, and endShape functions to define my lines point-by-point. For each shape made this way, PenPlotter will lower the pen, draw a series of lines connecting each point and then raise the pen. This is an easy way to control when PenPlotter sends pen down and up commands to penelope.
I found that by setting the dimensions of the offscreen PGraphics object (in pixels) to 71.95 times the dimensions of my paper (in inches), the exported SVG file is the correct size to be drawn at the default scale of PenPlotter.
Test plots
I’m pleased with the initial drawing results from penelope. I’ve run into some issues, but have been able to mitigate many of them. The overall accuracy of the lines is great.
I did have some issues, especially when drawing near the bottom of the page and when drawing curves consisting of many smaller lines. These issues included:
I had some trouble with the pen not staying in contact with the paper near the bottom of my drawing. Sliding the belt pulleys closer to the wall and adding weight to the gondola helped with this.
Sometimes, the beginning of each line did not ink well due to the pen not being in constant contact with the paper. Setting the servo.dwell value to 100ms in the PenPlotter properties fixed this.
I found the default movement of the servo was too quick, causing the gondola to bounce when lifting the pen and the pen to slam into the paper when being lowered. To slow this down a bit, I modified the PenPlotter software to send a series of incremental servo movements rather than a single command.
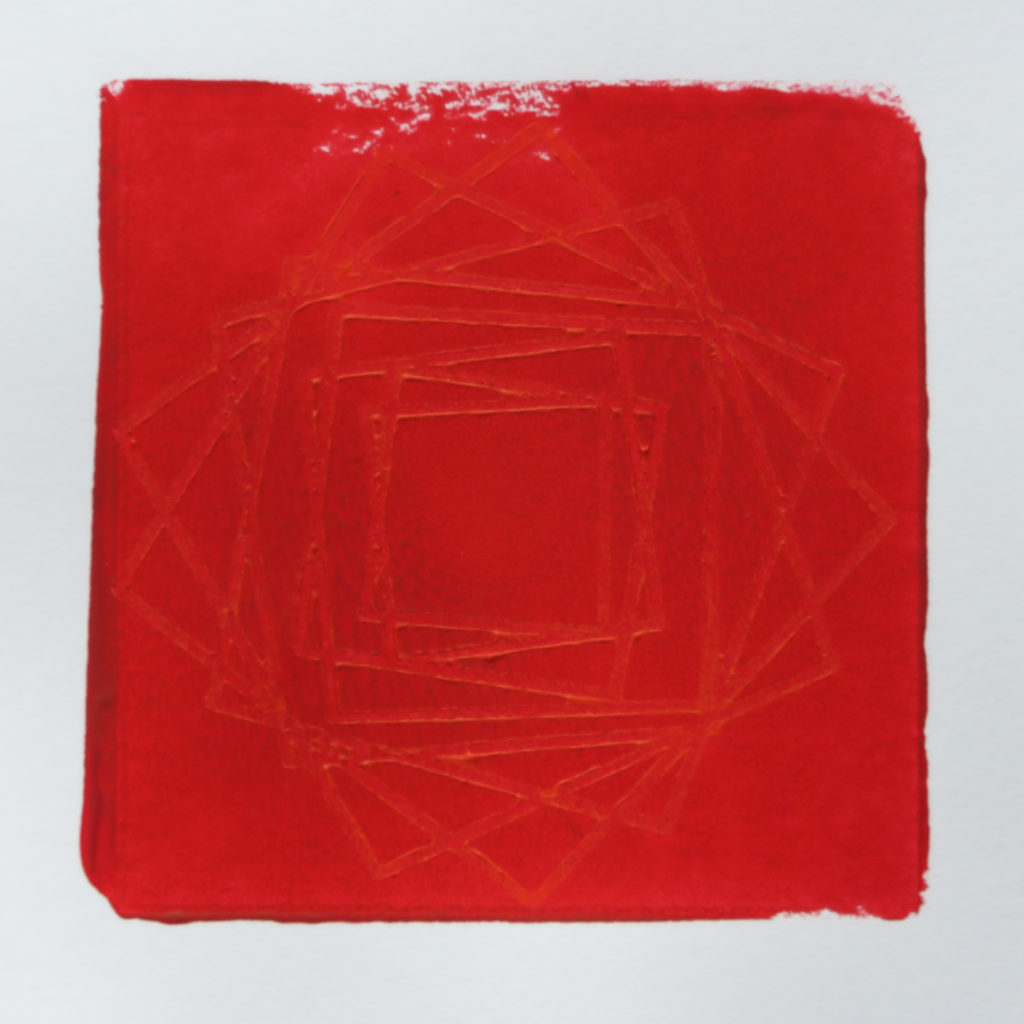
When most pens sit still on paper, they bleed ink. To help reduce the effects of this, I minimize the pen clearance between the page and the servo when the pen is down — this minimizes the time the pen is on the paper waiting for the servo to reach its final position.
If there is not sufficient clearance between the lifted pen and the page, it can accidentally draw when moving from the end of one shape to the beginning of another. However, lifting it too high can unnecessarily slow the overall drawing.
Many short lines drawn one after another can create pen jitter. Adding weight to the gondola helps with this.
The plotter does not create enough downward force to use pencils (HB) and some pens (for example, Sharpie S-gel). This is somewhat mitigated by adding weight to the gondola; however, it is not feasible since more and more weight is needed the further down the page you go.
Below is another video, this one showing parts of 2 hour plot. If you’ve built a similar plotter and have tips for me, please leave them in the comments below.
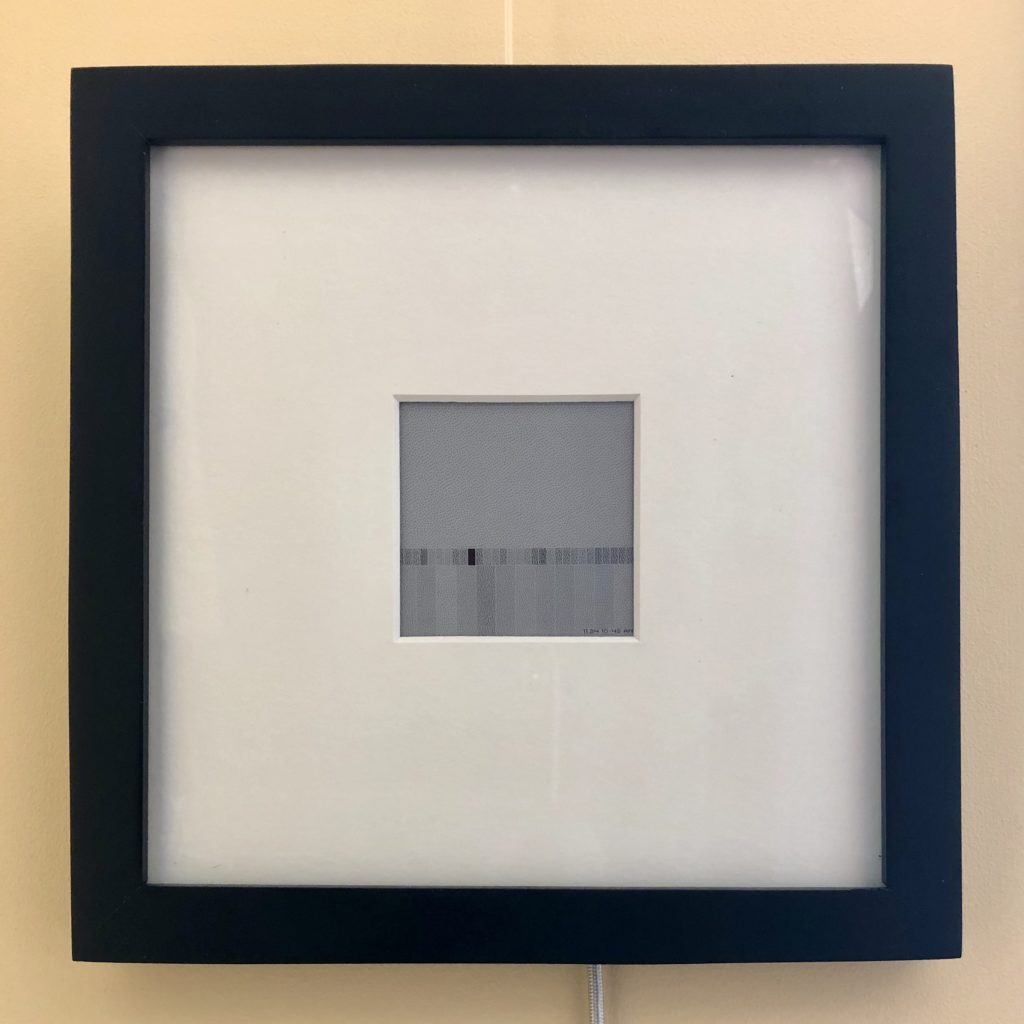
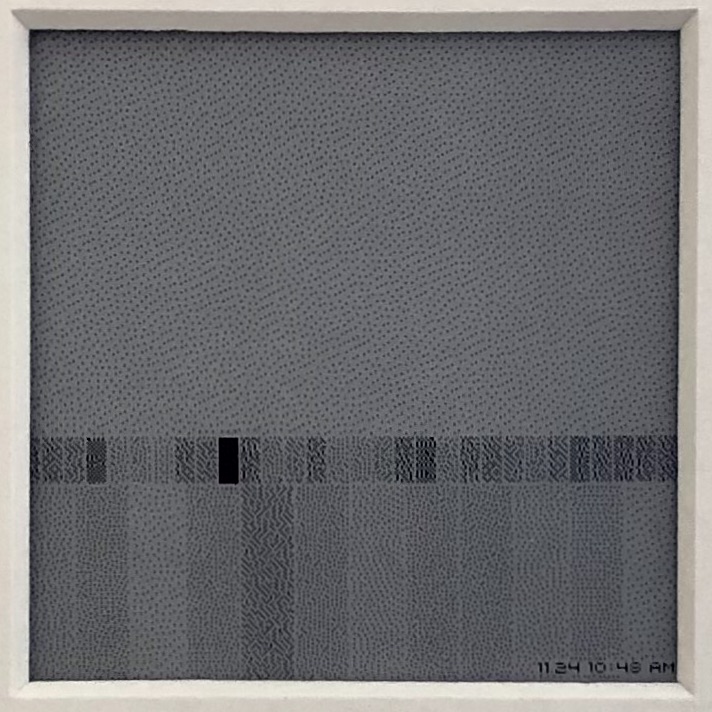
Visualization of earthquakes in the San Francisco Bay Area. Grey value indicates the magnitude of the most recent quake (top), all quakes in the past 24 hrs (bottom), and max quake each day for the past 30 days (middle).
Made using a Raspberry Pi Zero W and a Pimoroni Inky wHAT, mounted in an 8 inch square frame.
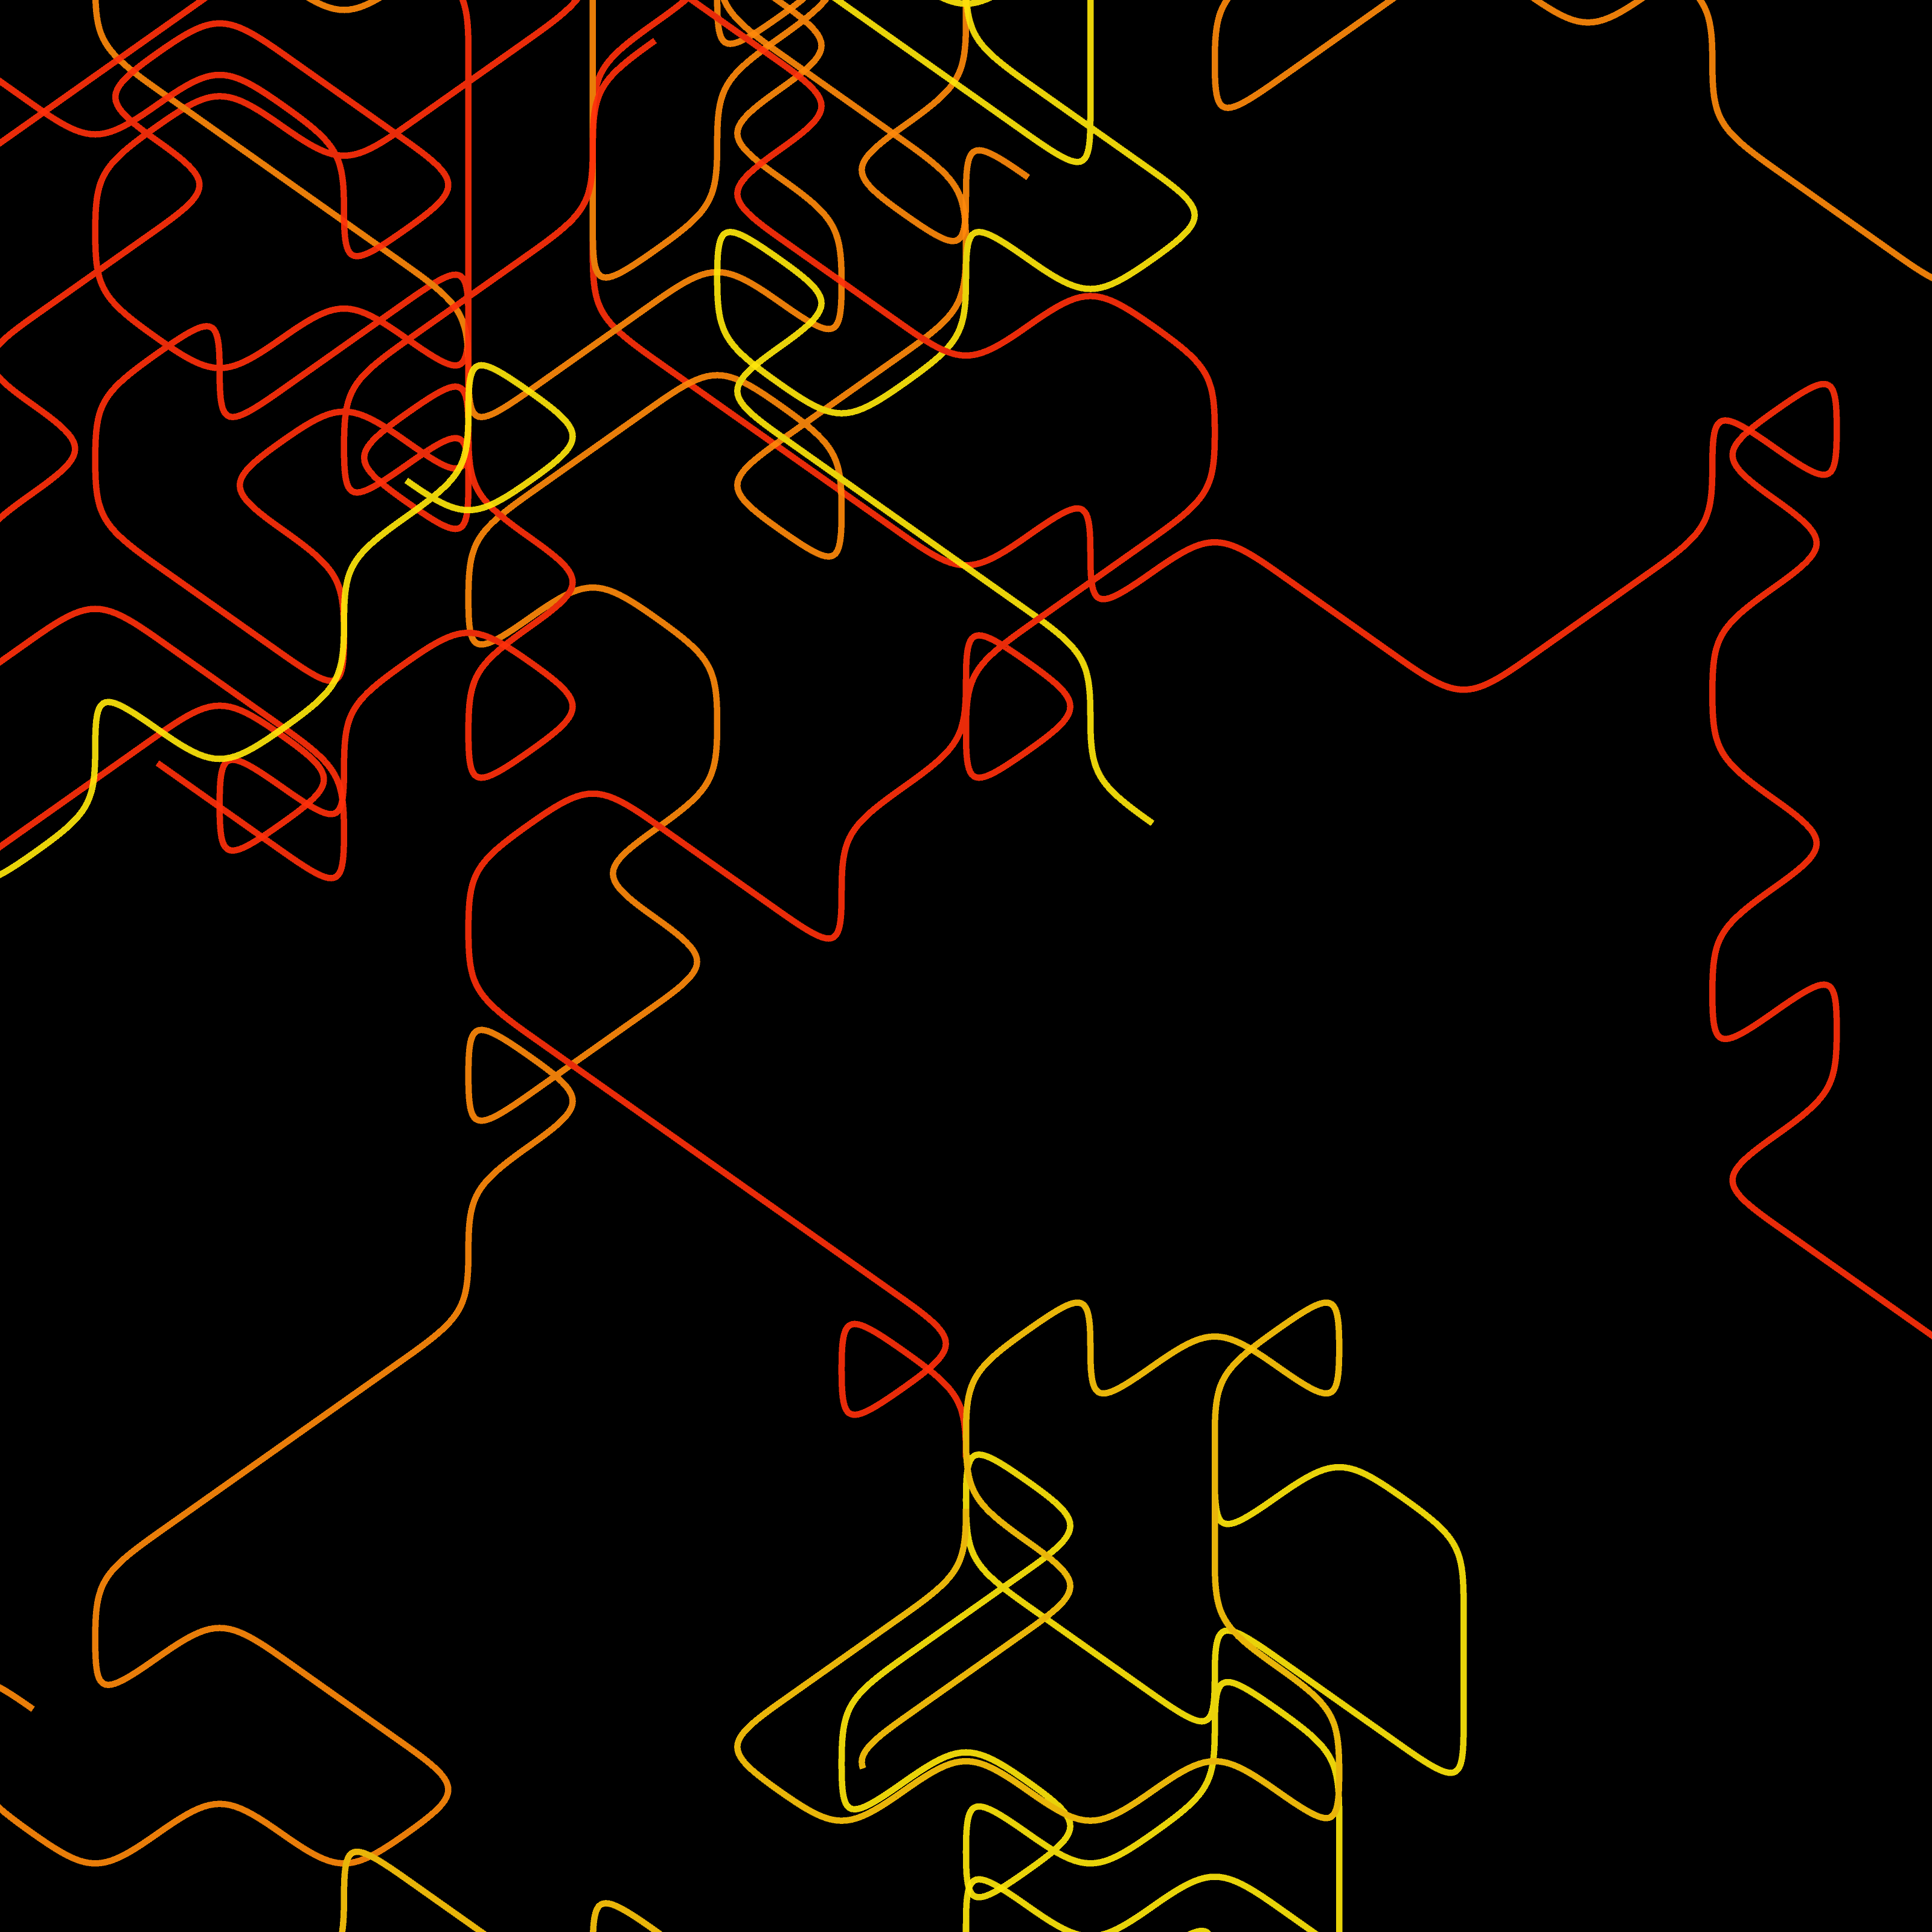
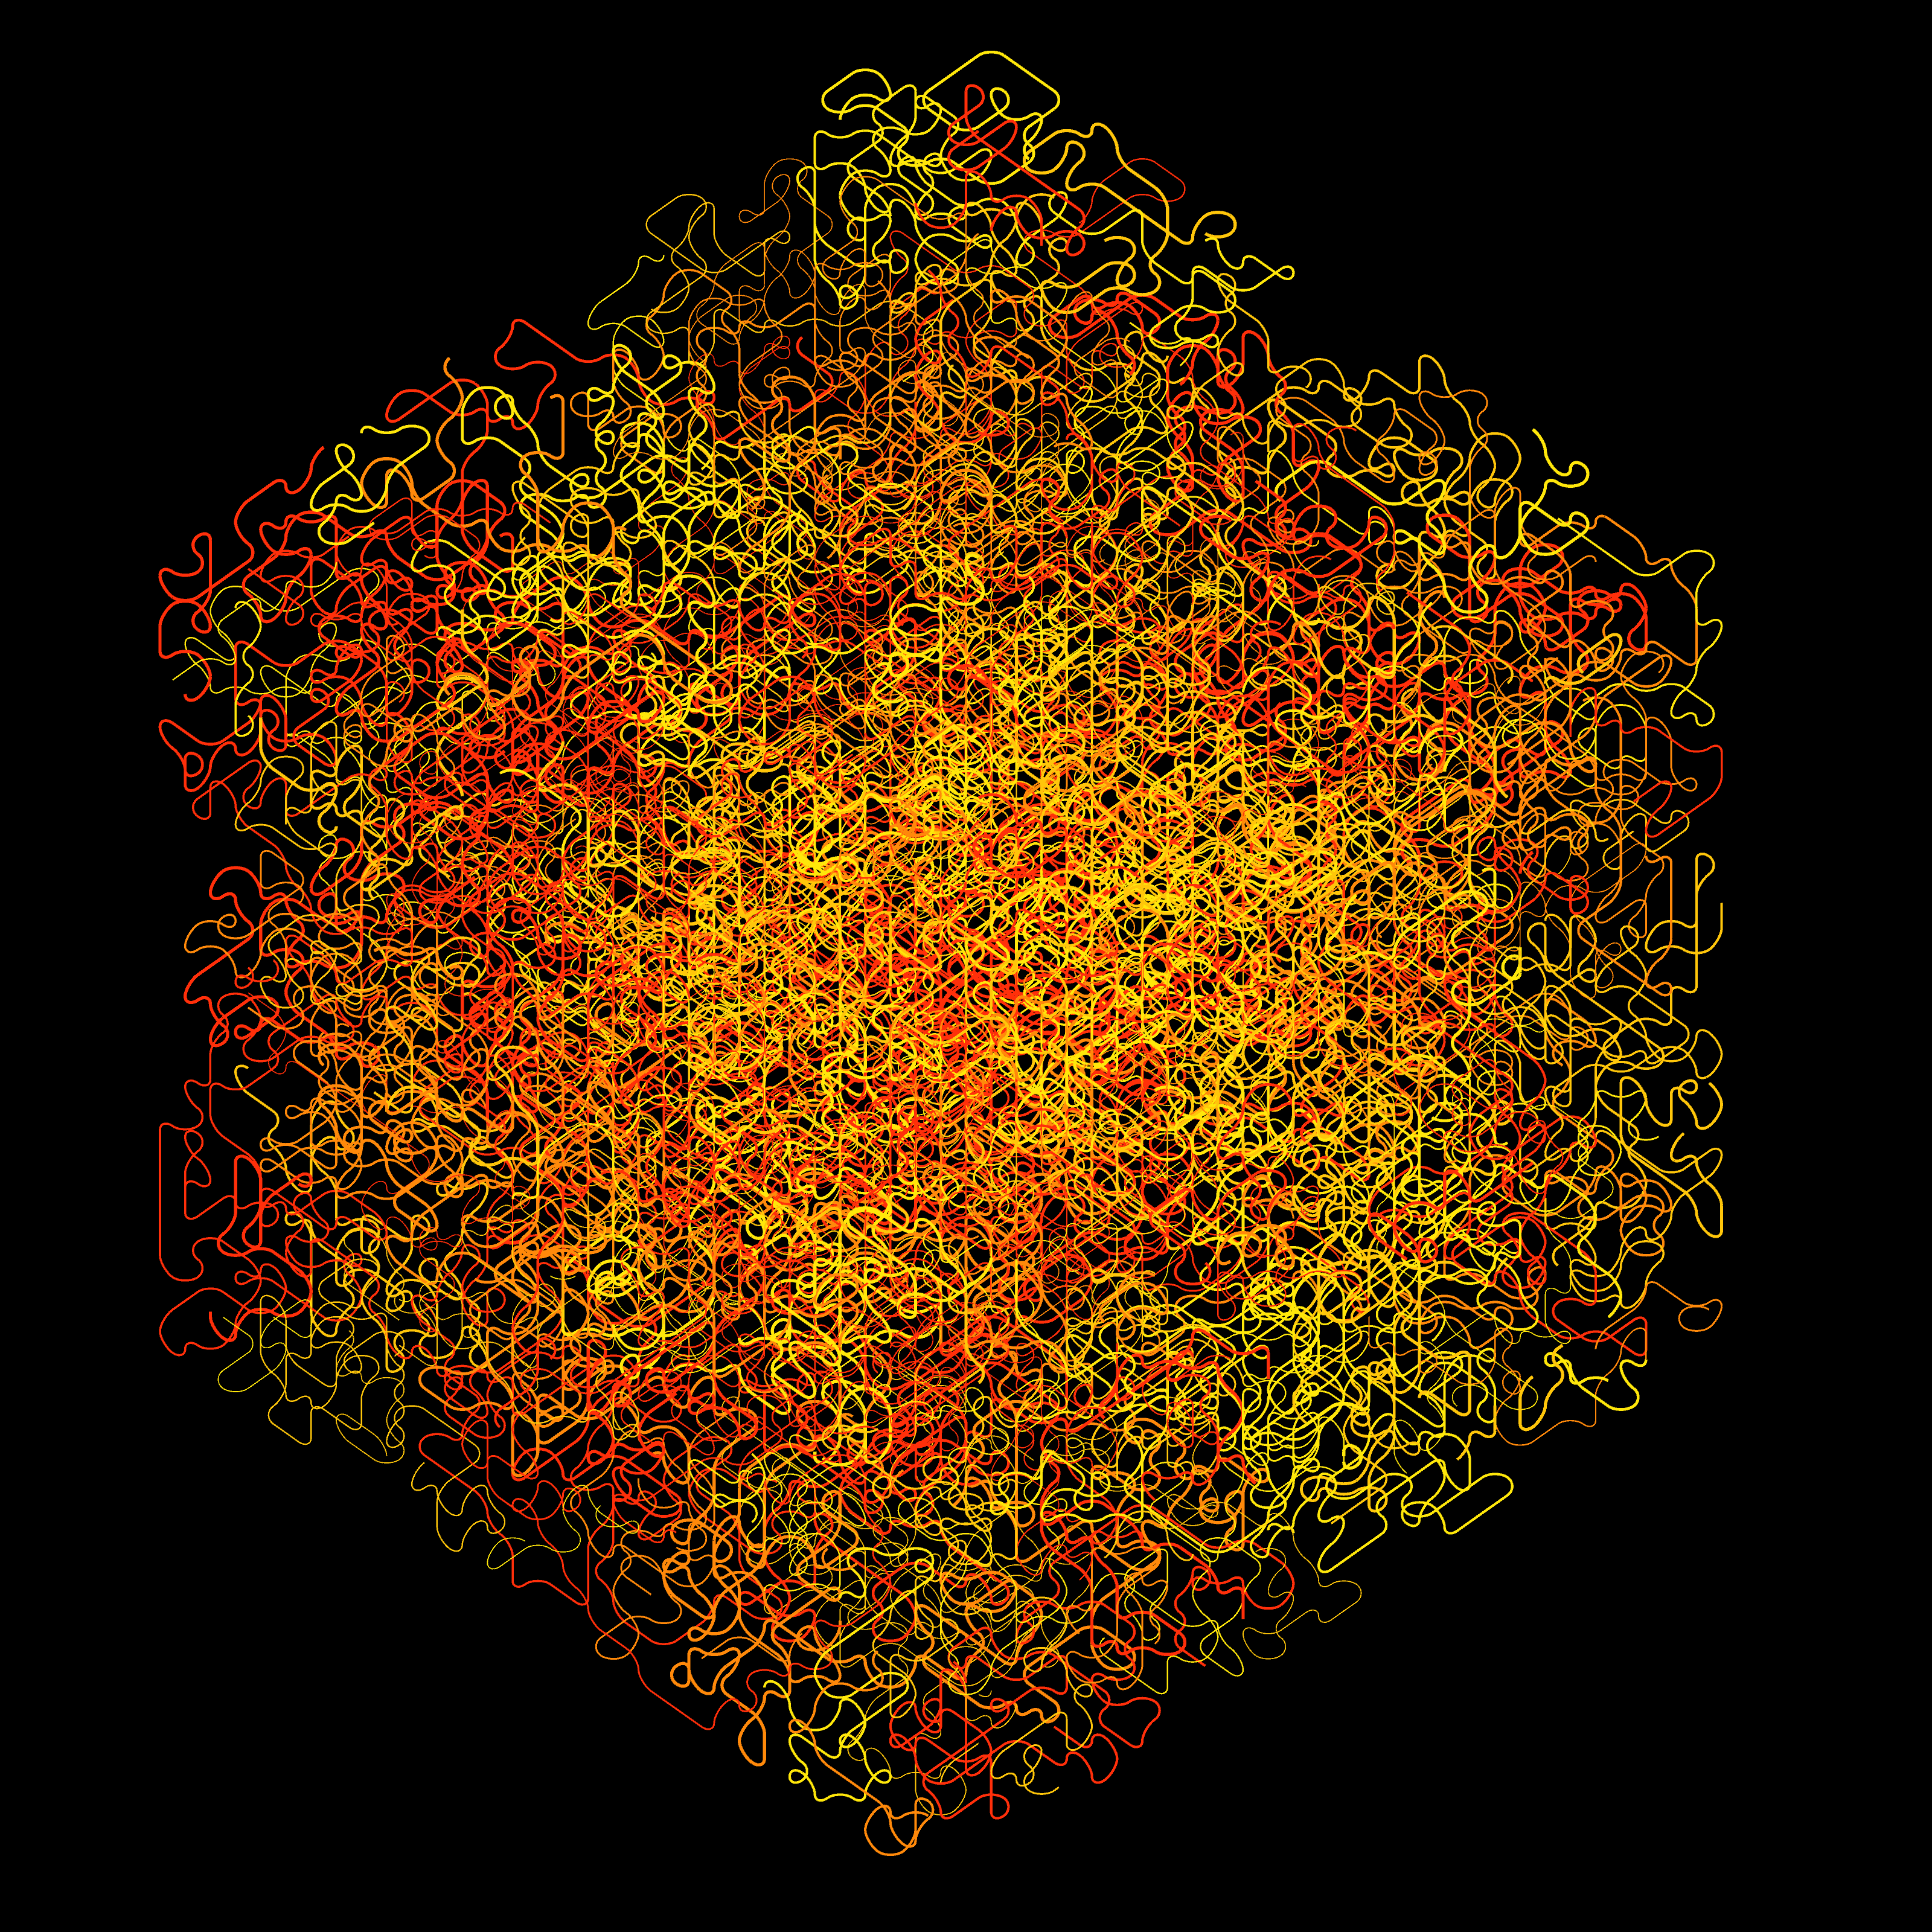
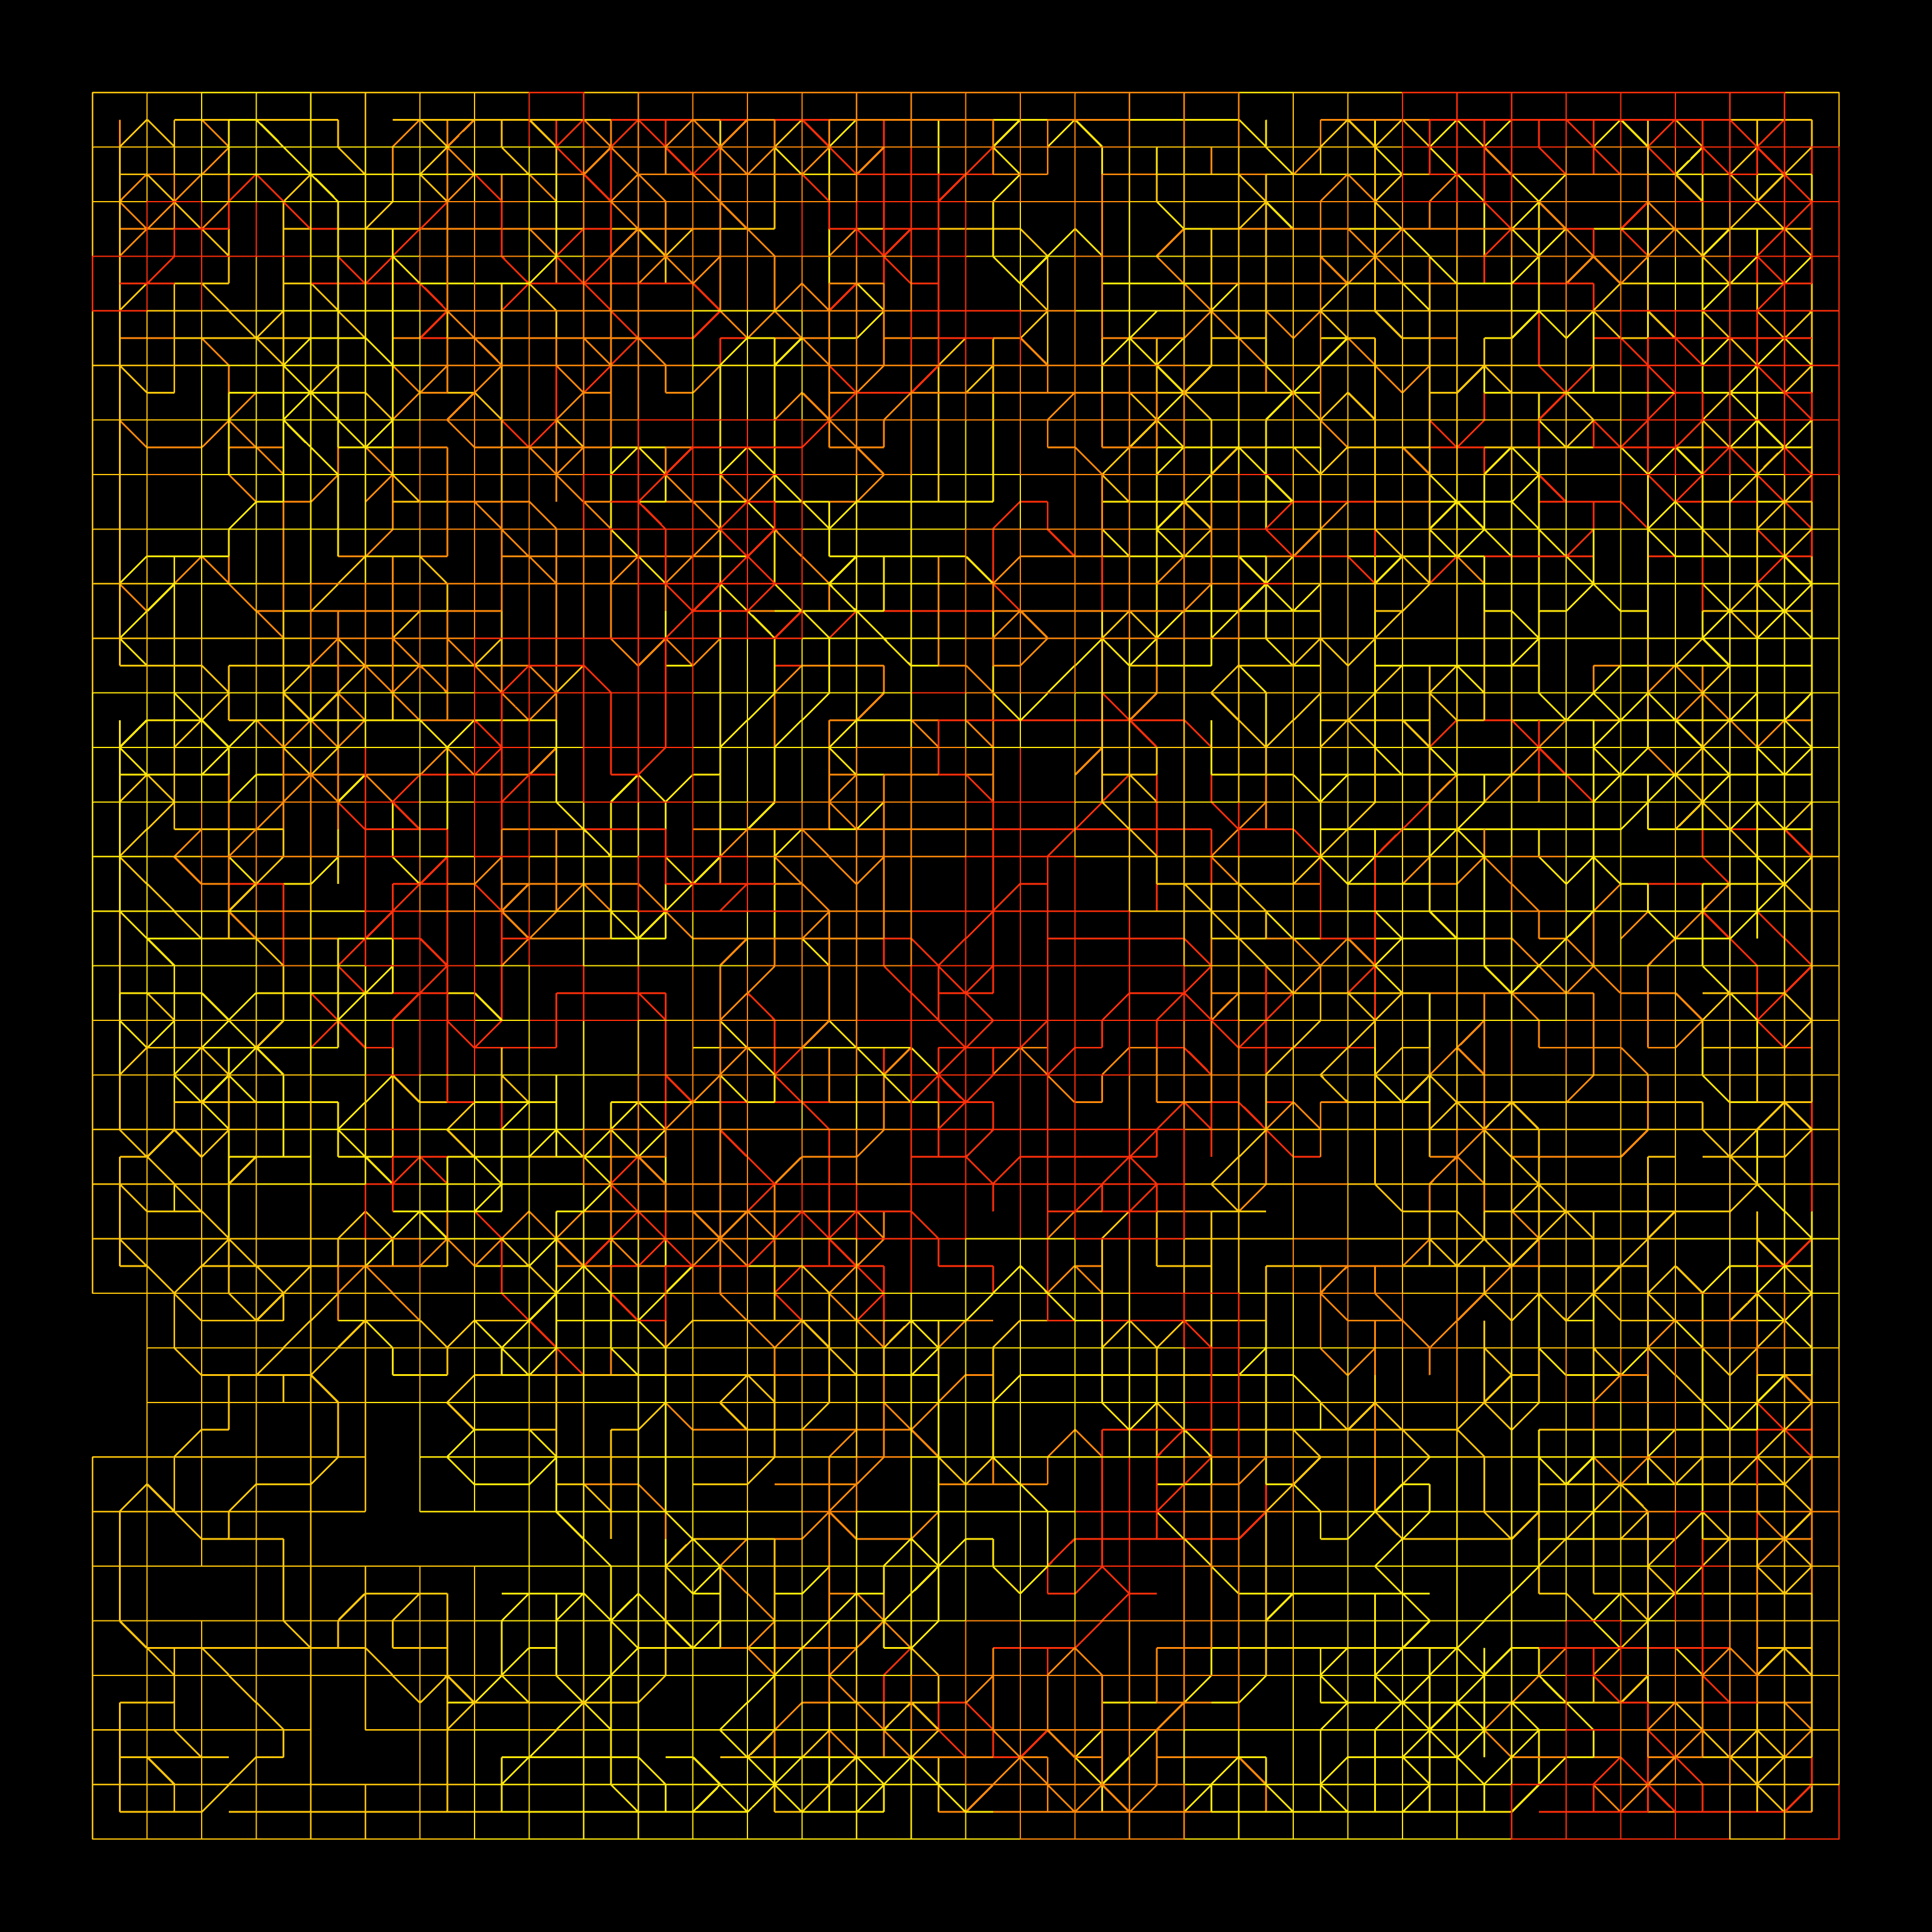
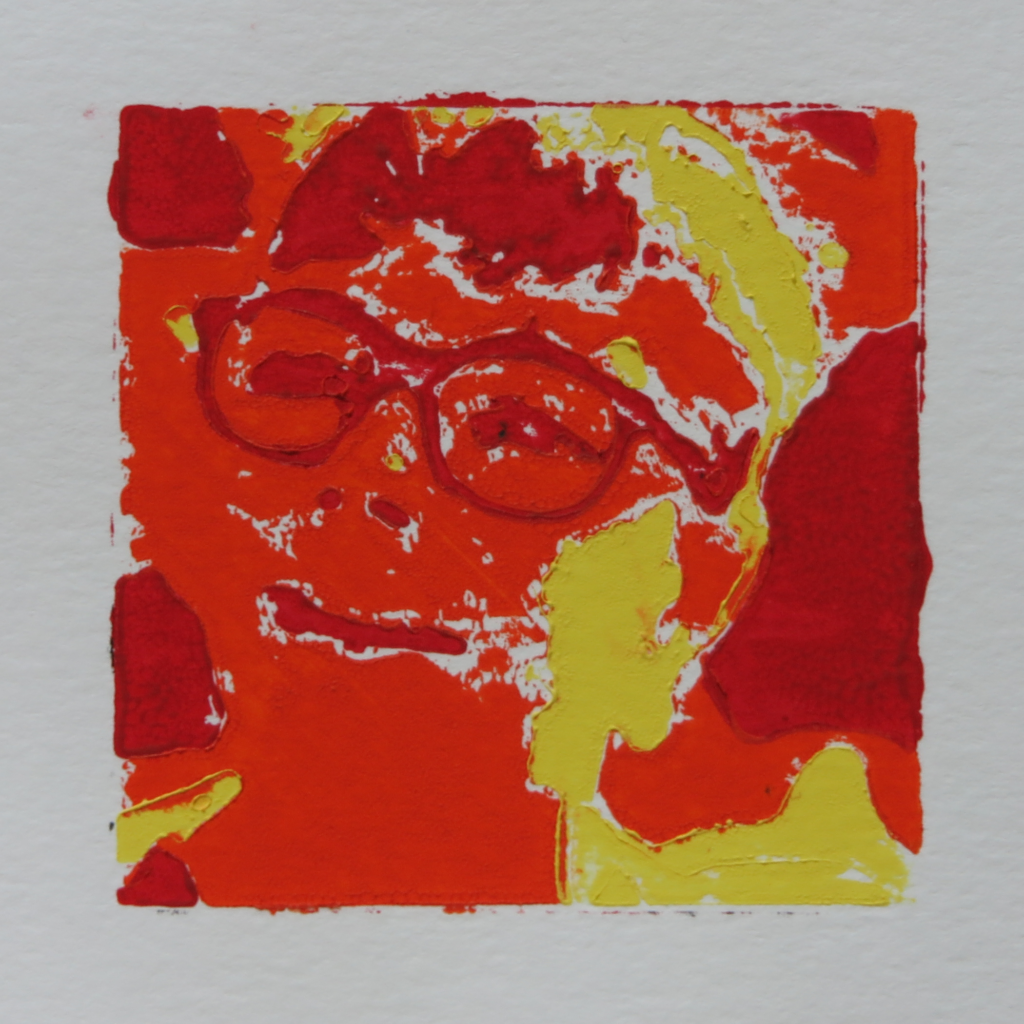
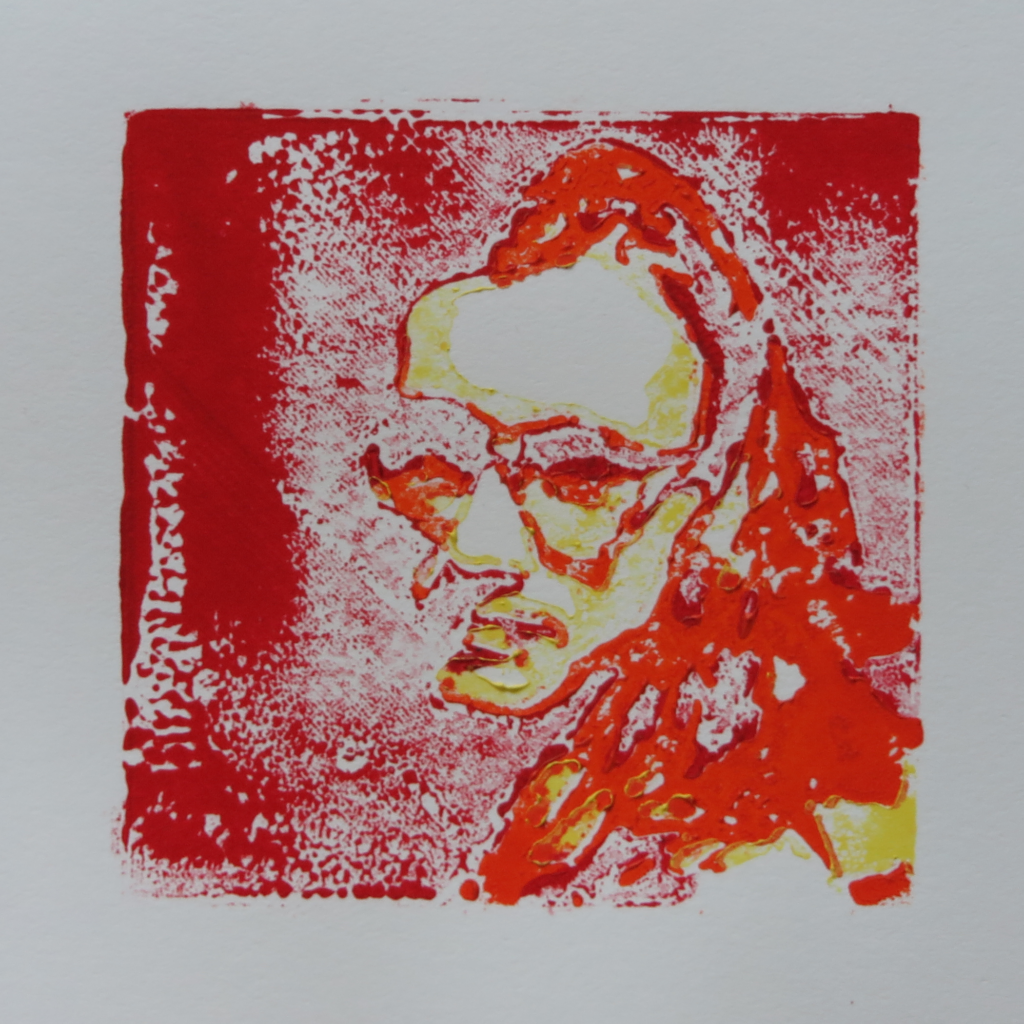
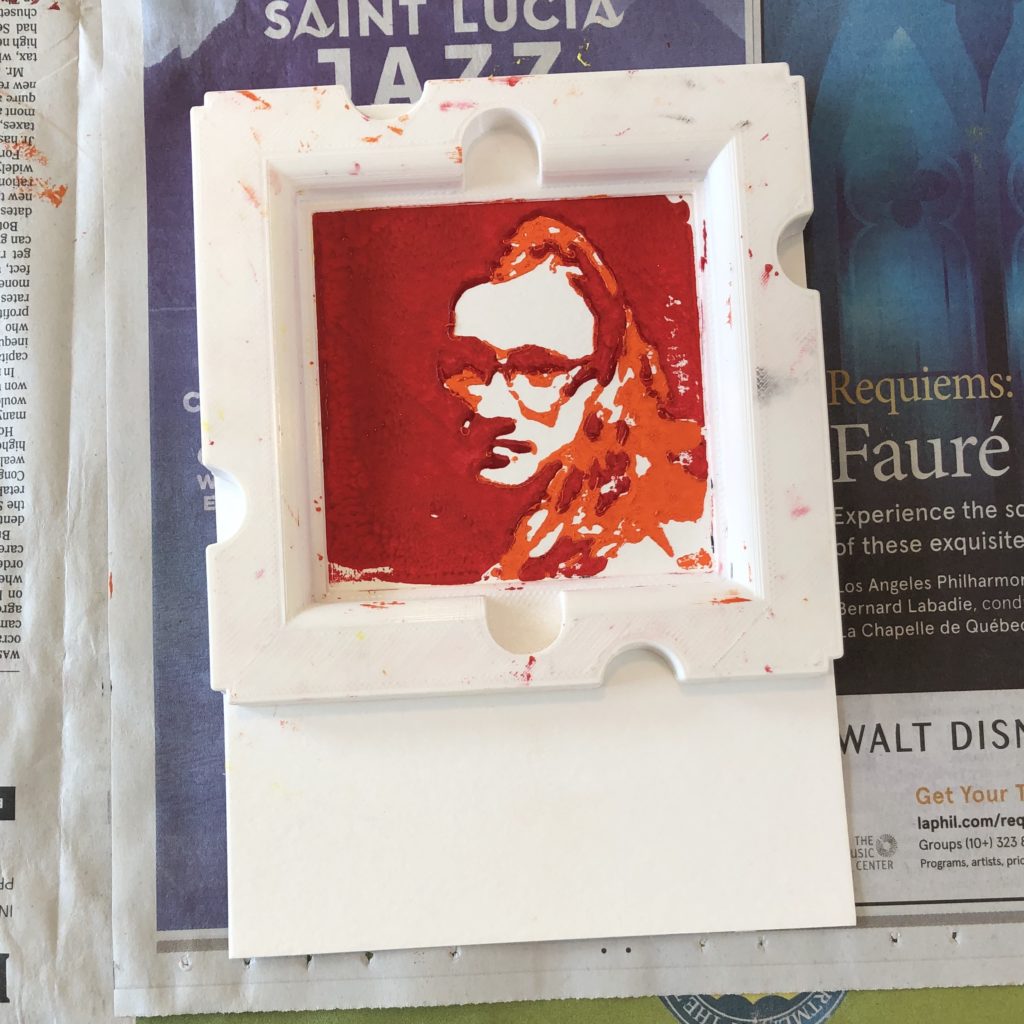
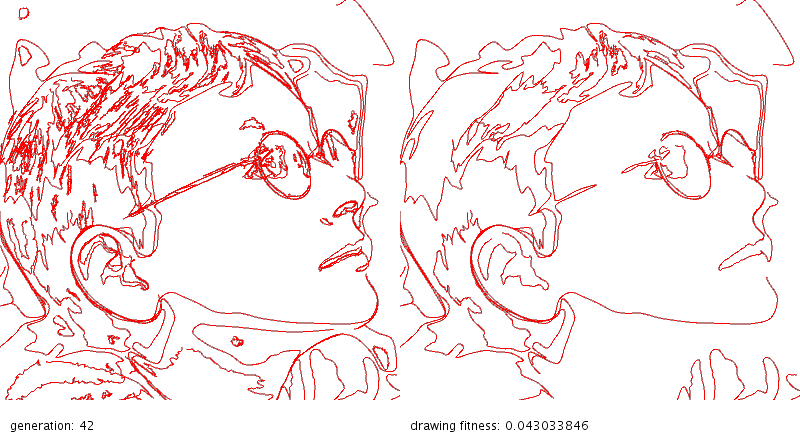
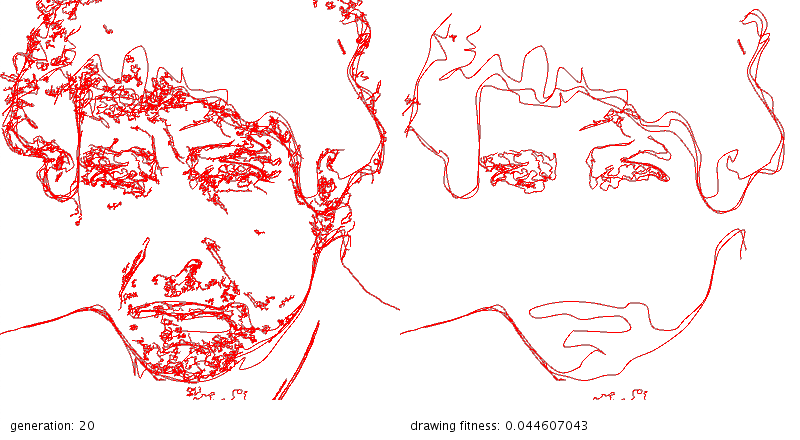
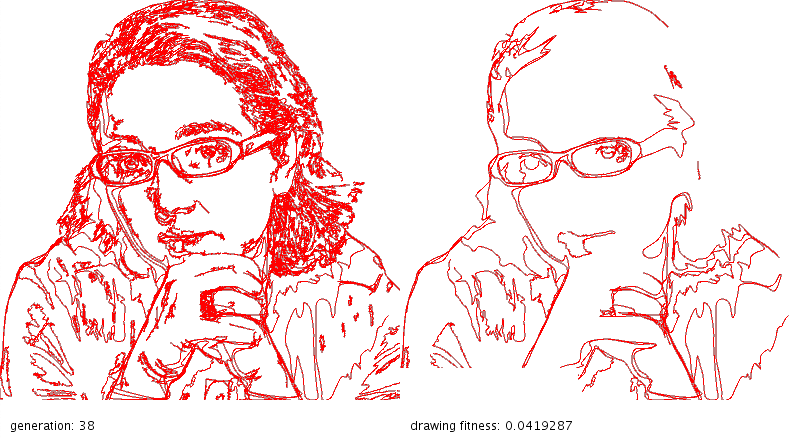
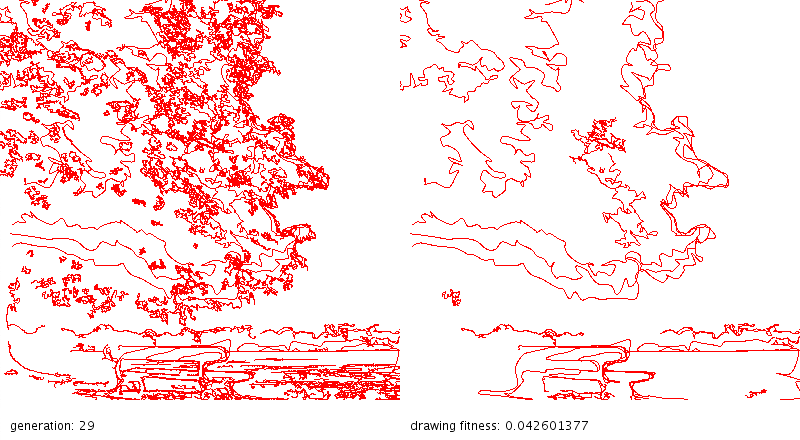
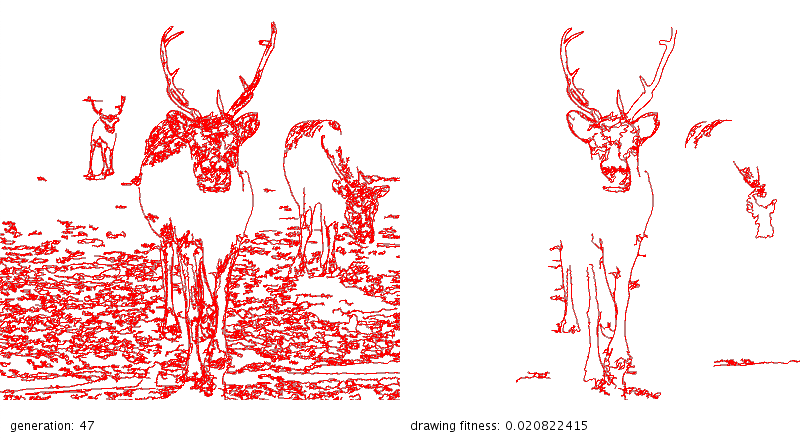
These drawings were extracted from images using a combination of OpenCV and a genetic algorithm.
First, OpenCV is used to find contour lines and canny edges in the images. On the left are all the lines found this way (typically hundreds of lines) that have been post-processed a bit to smooth longer lines.
On the right are 20 lines selected by the genetic algorithm. The algorithm generates 100 drawings, each with a different set of lines from the drawing on the left. It then automatically evaluates the fitness of each drawing and creates a new generation of 100 drawing, selecting characteristics more often from the highest rated drawings and tossing in some random mutations.
The goal is to capture the essence of the original image in just a few vector lines so that a drawing robot can efficiently recreate it. Below are more examples.
I’ve been looking into procedural modeling using Grasshopper. This first model is based on an exercise detailed in the this Primer: http://grasshopperprimer.com/en/index.html?index.html.